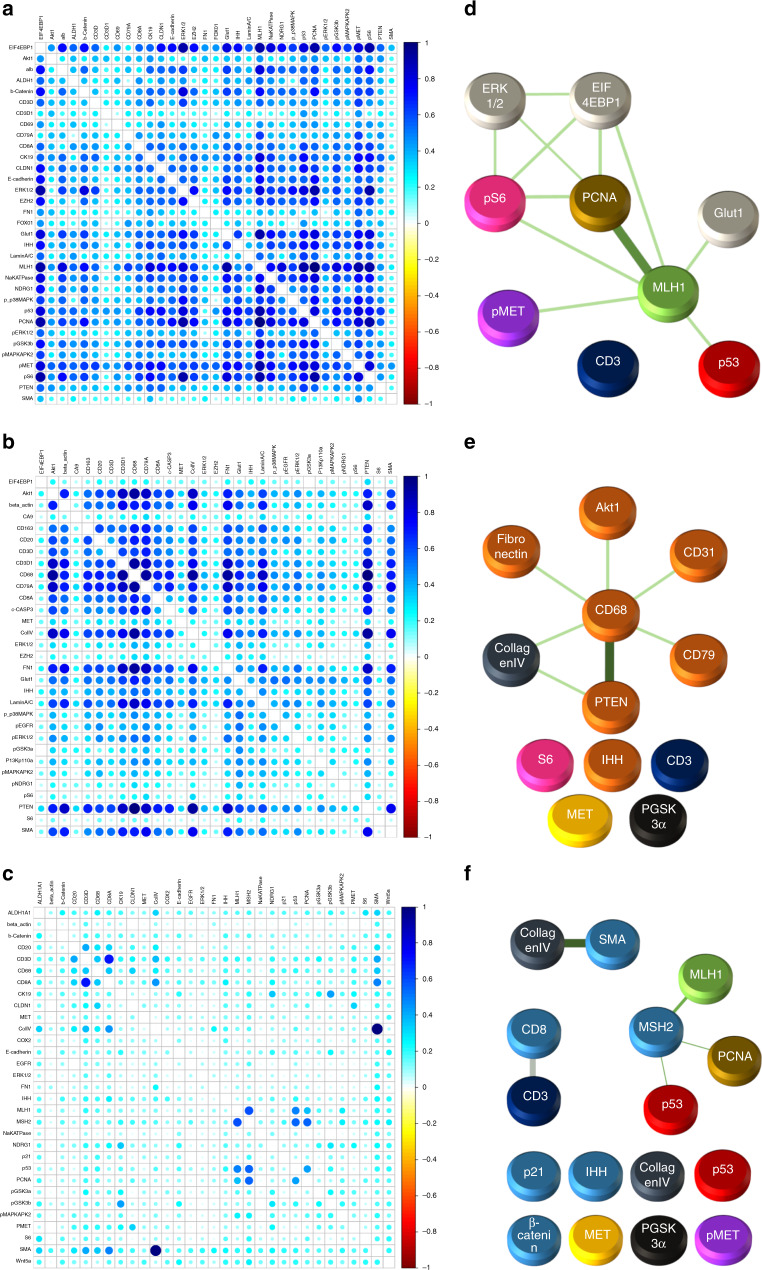
Fig. 5. SpAn derived spatial-domain networks.
a Epithelial domain, b Stromal domain, and c Epithelial-stromal domain Jensen–Shannon divergence matrices that show the information distance of partial correlations (computed for biomarkers selected by recurrence-guided SpAn feature selection and stability analysis) between patients in the no-evidence-of-CRC and CRC-recurrence cohorts. d Epithelial domain, e Stromal domain, and f Epithelial-stromal domain spatial-domain networks obtained by thresholding the corresponding spatial-domain information distance matrices at the 99th percentile, which identify differential change most significant for CRC-recurrence prognosis. (The graphical and color rendering is to ensure ease of visualization.) All three spatial-domain networks include disconnected subnetworks with isolated nodes. These nodes correspond to biomarkers selected by SpAn as indicated in blue in Fig. 3. Biomarker expression is an intrinsic property that, unlike correlations, does not describe relationships between different biomarkers, and therefore, is naturally expressed by an isolated node without any connecting edge.

