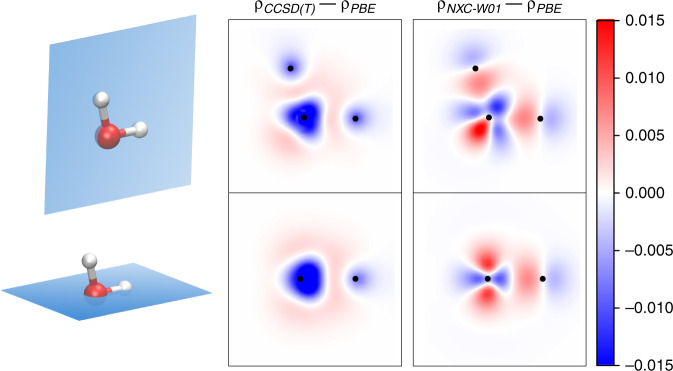
Fig. 7. Electron density of water.
Comparison of the difference in electron density between CCSD(T) and PBE and NXC-W01 and PBE for a water molecule in its experimental equilibrium geometry. Two dimensional cuts either correspond to high-symmetry planes or planes containing a significant number of atoms and are indicated by blue surfaces in the molecule depictions adjacent to the density plots. Black dots inside the density plots indicate the positions of in-plane atoms. Atoms are color-coded with red corresponding to oxygen and white to hydrogen. Color scale is in units of e × Bohr−3.

