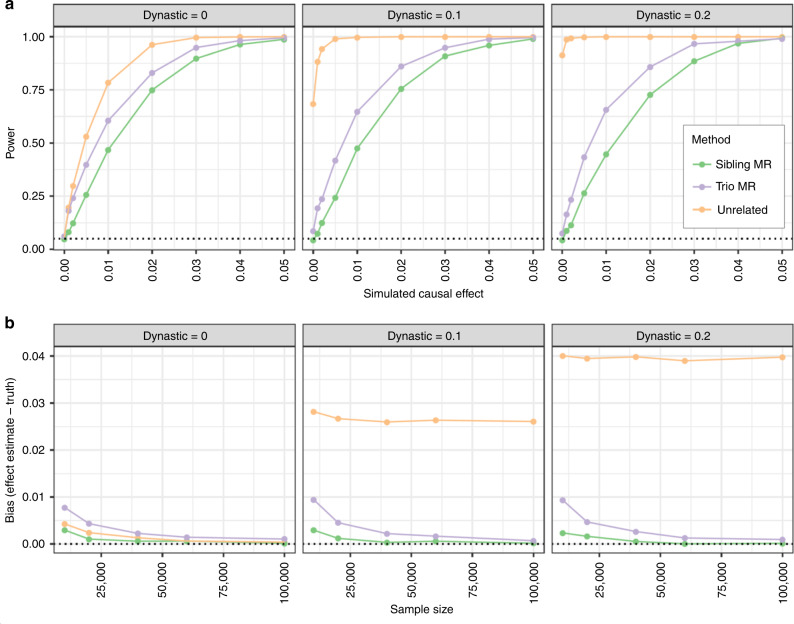
Fig. 2. Results of simulations comparing different Mendelian randomization study designs for power and bias.
a SNP-exposure r2 = 0.05; sample size = 10000 singletons, sibs, or trios; simulation involves an influence of parental exposure influencing child’s confounder, which explains 10% of variance in child exposures and outcomes. For a simulated causal effect = 0, we expect the false discovery rate to be 0.05. b Estimated bias by sample size using different Mendelian randomization designs. The simulations are similar to a but allow sample size to vary and fixing the causal effect of an exposure x on an outcome y to 1% of variance explained. The bias in within-family Mendelian randomization estimates is slightly elevated when sample sizes are small due to weak instrument bias, but are otherwise are protected from the large bias seen when using unrelated samples.

