
Figure 1.
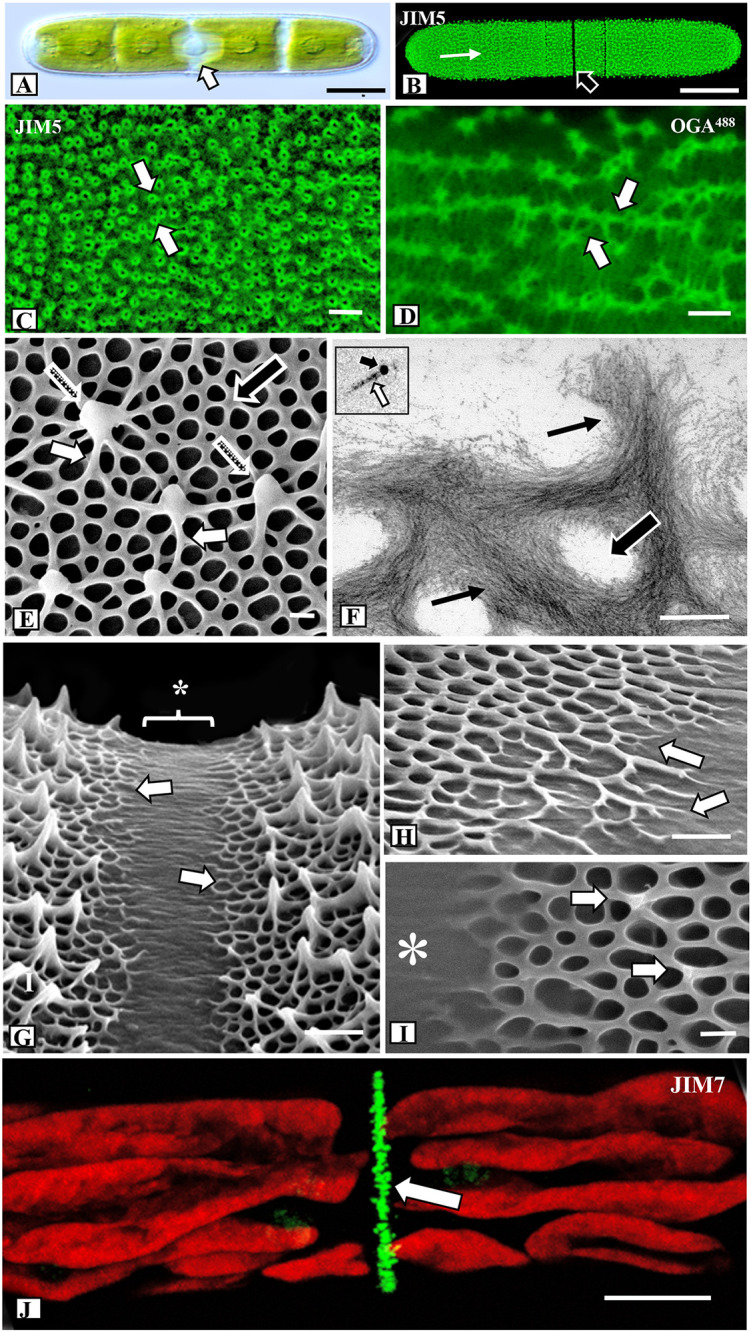
Microarchitecture of the pectin lattice. (A) Differential interference contrast (DIC) image of Penium showing its typical cylindrical shape and the central isthmus zone (arrow) where new cell wall material is deposited. Bar, 15 µm. (B) JIM5 (specificity: Homogalacturonan, HG, with low degree of methyl-esterification; Clausen et al., 2003) labeling of the HG lattice (white arrow) of a live cell. Note the lack of labeling at the isthmus (black arrow). Confocal laser scanning microscopy (CLSM) image. Bar, 15 µm. (C) Magnified view of the JIM5-labeled HG lattice. Note the fluorescently-labeled circular components (arrows) that represent the tips of the lattice projections. CLSM image. Bar, 22 nm. (D) OGA7-13488 (specificity: and oligogalacturonide probe that binds to oligogalacturonide probe that HG with 7-13 contiguous GalAs; Mravec et al., 2017b) labeled HG lattice. Note the enhanced resolution of the fibers (arrows) that constitute the lattice. CLSM image. Bar, 25 nm. (E) Field emission scanning electron microscopy (FESEM) image of the HG lattice. Note the network of basal fibers (black arrow) that occasionally branch outward (small white arrows) to yield the thickened projections (stippled arrows). Bar, 215 nm. (F) Transmission electron microscopy (TEM) image of the HG lattice. Note the tight aggregation of thin fibrils (arrows) that form the basal fibers. Openings are present between the fibers (large arrow). Bar, 225 nm. Inset: HG fibril (white arrow) near 10 nm gold particle (black arrow). (G) FESEM image of the isthmus zone. The center of the isthmus (*) is smooth while at the two edges (arrows) the basal fibers emerge from the inner wall layers. Bar, 725 nm. (H) Magnified FESEM image of the branching basal fibers (arrows) emerging from the isthmus (arrows). Bar, 450 nm. (I) The formation of the lattice projections occurs approximately 250 nm from the edge of the isthmus (*). Bar, 225 nm. (J) JIM7 (specificity: Homogalacturonan, HG, with high degree of methyl- esterification; Clausen et al., 2003) labeling of high esterified HG deposition at the isthmus (arrow). CLSM image. Bar, 8 µm.