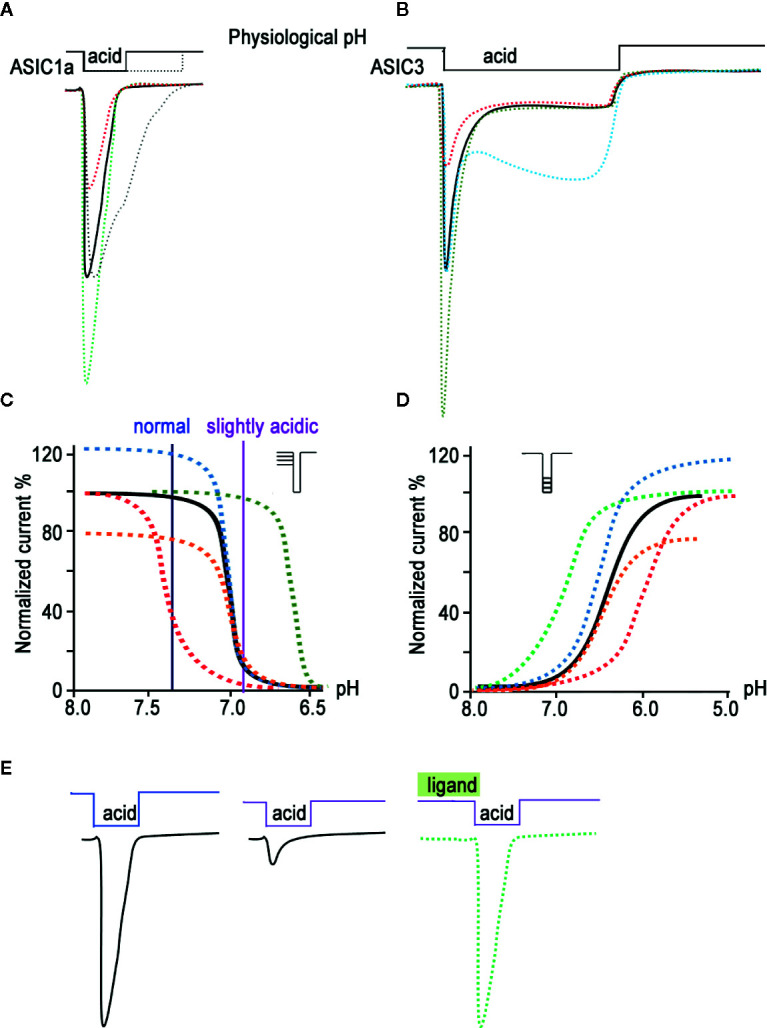
Figure 1.

Biophysical properties of ASICs. The characteristic traces of currents recorded in whole-cell configuration are presented for ASIC1a (A) and for ASIC3 (B) as a black line; currents modified by ligands application are represented in green (potentiation) and red (inhibition). The gray line in (A) and cyan line in (B) reflect the process of desensitization kinetics change. The pH dependence of the channel gating is shown as a result of steady-state desensitization (SSD) (C) and as dependence of currents’ amplitude by various acidic stimuli applied (D) for the channel alone (black line). The potentiating effect of ligands is demonstrated as green and blue curves, and the inhibiting effect as red and orange curves. (E) Current traces reflect the effect of pH-dependent SSD. In a weakly acidic environmental medium, the channel loses its ability to fully respond to a stronger acid stimulus; however, the addition of a ligand is able to restore its properties (green line).
