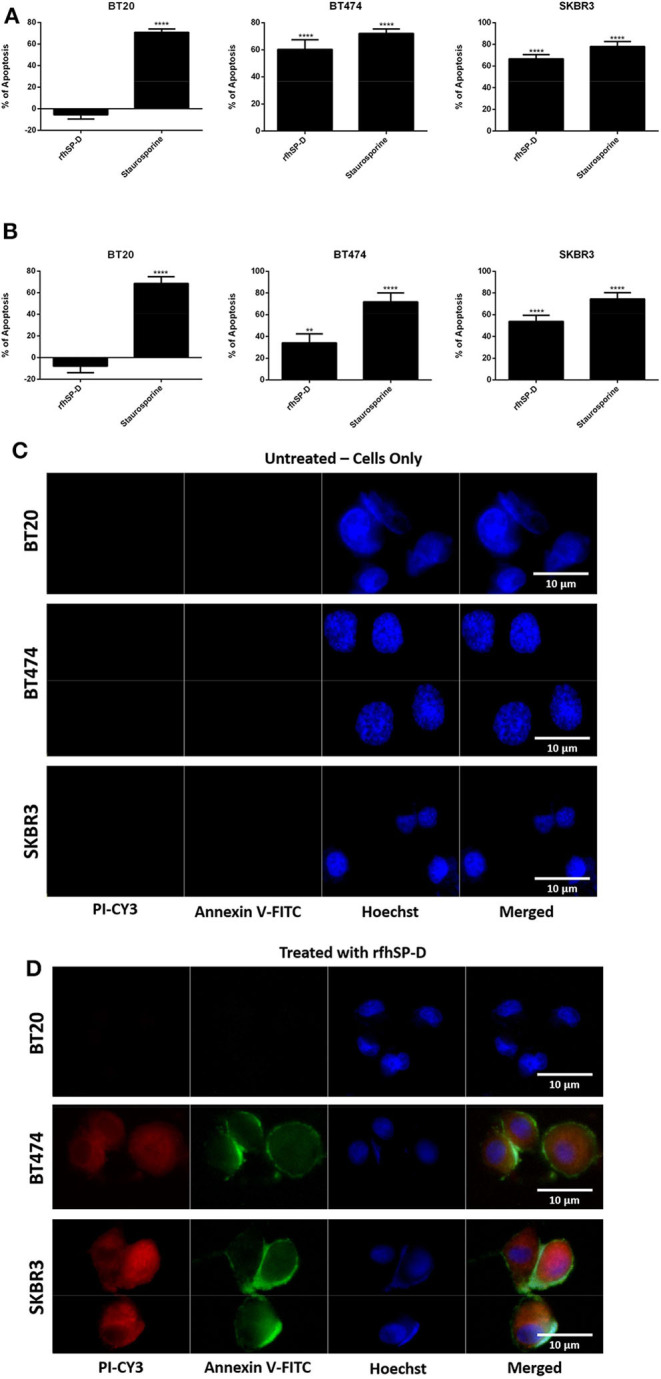
Figure 2.

Flow cytometric analysis of apoptosis induction in breast cancer cells treated with 20 μg/ml of immobilized (A) and solution-phase (B) rfhSP-D for 24 h. For both Annexin V/FITC and DNA/PI staining, 12,000 cells were acquired and plotted. A significant difference was seen among treated and untreated (cells only) samples, as evident by the shift in the fluorescence intensity. The data were expressed as the mean of three independent experiments (n = 3) done in triplicates ± SEM. Statistical significance was established using the unpaired one-way ANOVA test (**p < 0.01 and ****p < 0.0001). The percentage of apoptosis was calculated by normalizing the treated cells with their untreated counterparts. Fluorescence microscopy analysis of apoptosis induction in breast cancer cells treated with rfhSP-D (20 μg/ml) for 24 h, using an Annexin V with a propidium iodide (PI) staining kit; untreated (cells only) controls (C) and rfhSP-D-treated cells (D). The nucleus was stained with Hoechst (1:10,000), and the cell membrane was stained positively with Annexin V and PI (1:200) in treated cell lines, suggesting that cells treated with rfhSP-D induced apoptosis at 24 h, where translocation of PS to the outer plasma membrane was able to bind Annexin V due to loss of membrane integrity and PI stain was taken, which stained the DNA of apoptotic cells. No Annexin V/PI staining was detected in untreated cells.
