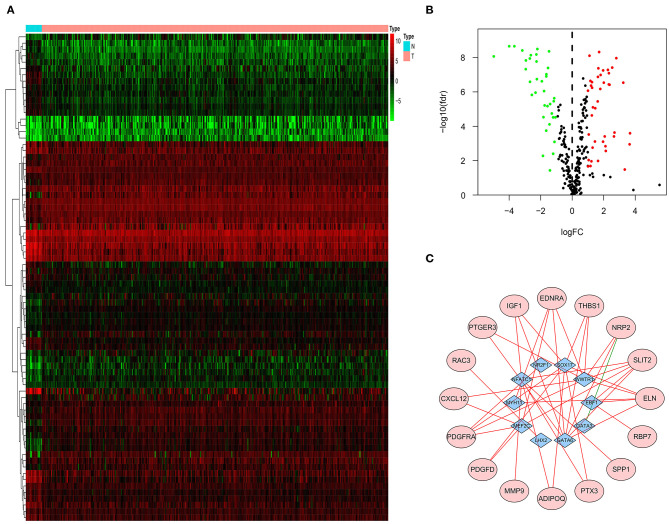
Figure 2.
TF-related genes regulating prognostic immune-related DEG. Heatmap (A) and volcano plot (B) indicating TF-related DEG. (C) A gene regulatory network between TF-related DEG and immune-related DEG. The purple ellipses represent the immune-related DEG. The blue diamonds represent TF-related DEG. The red and green solid lines represent positive and negative correlation, respectively.

