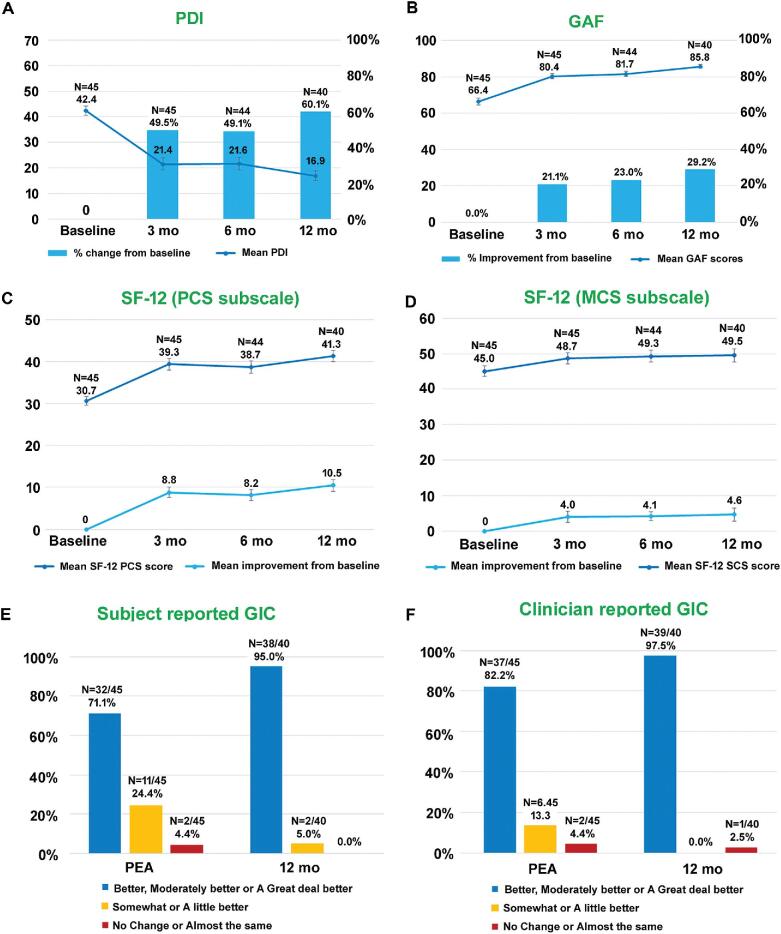
FIGURE 4.
Improvement in quality of life and functioning after the 10-kHz SCS treatment. A, PDI scores and percentage change from baseline. B, GAF scores and percentage improvement from baseline. C, SF-12 (PCS subscale) scores and mean improvement from baseline. D, SF-12 (MCS subscale) scores and mean improvement from baseline. E, Subject reported GIC. F, Clinician reported GIC. Data shown include mean ± SEM at indicated assessment times.

