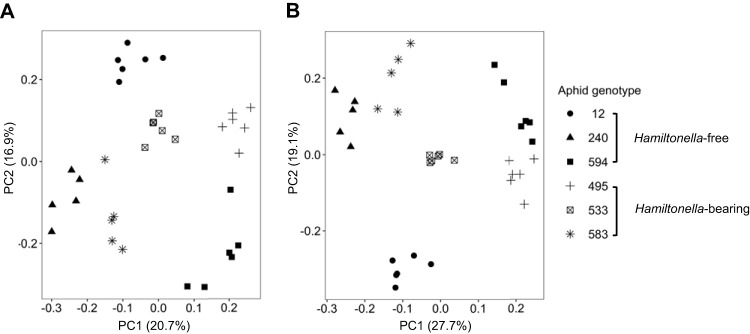
FIG 1.
Principal-component analysis (PCA) of aphid metabolites quantified using untargeted liquid chromatography-mass spectrometry (LC-MS). (A) Positive mode. (B) Negative mode. Individual points represent biological replicates, and each symbol corresponds to an aphid genotype. The variance explained by each principal component axis is shown in parentheses.

