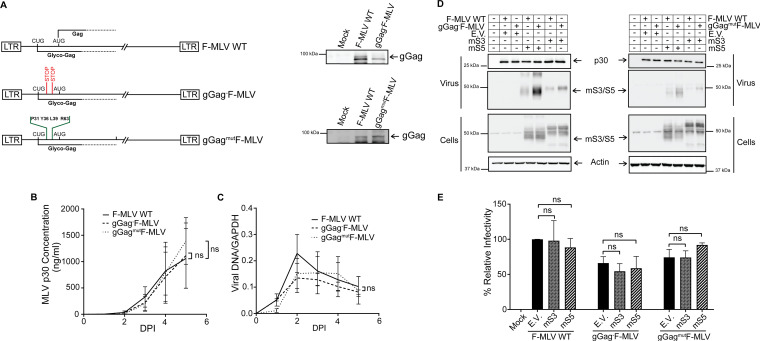
FIG 3.
mSERINC3 and mSERINC5 have no effect on ecotropic MLV infection in vitro. (A) Schematic diagram of glyco-Gag (gGag) mutant MLV constructs. Positions of translation start codons (CUG for glyco-Gag and AUG for Gag) and the two stop codons inserted at amino acids 32 and 55 within the glyco-Gag reading frame to generate gGag−F-MLV are shown. In the case of the gGagmutF-MLV construct, glyco-Gag residues P31, Y36, L39, and R63 were mutated to alanine (A). Shown on the right are immunoblots of lysates from 293T cells transfected with F-MLV WT, gGag−F-MLV, and gGagmutF-MLV constructs and probed with a goat anti-MLV antibody for the detection of gGag. (B and C) Growth curves of the gGag mutant viruses. NIH 3T3 cells were infected with F-MLV WT, gGag−F-MLV, and gGagmutF-MLV (MOI 0.1). Virus replication was determined by performing p30 (CA) ELISAs to determine virus levels in the culture supernatants at the indicated time points (B) and by RT-qPCR for MLV DNA levels normalized to GAPDH in the infected NIH 3T3 (C). (D) mSERINC3 and mSERINC5 incorporation into the budding virions is glyco-Gag dependent. 293T cells were cotransfected with F-MLV WT/gGag−F-MLV/gGagmutF-MLV and mSERINC3, mSERINC5, or empty vector as indicated. At 48 h posttransfection, cells and released virus in the culture media were harvested and the indicated proteins were analyzed by immunoblotting using anti-MLV p30, anti-HA (for detection of mSERINC3 and mSERINC5) and anti-β-actin antibodies. (E) mSERINC3 and mSERINC5 do not affect F-MLV infectivity in vitro. Mus dunni cells were infected with equal amounts of 293T-derived F-MLV WT or gGag−F-MLV or gGagmutF-MLV virus produced in the presence of mSERINC3, mSERINC5, or empty vector. Genomic DNA was isolated 5 h postinfection (hpi), and MLV DNA levels were measured by RT-qPCR. Viral DNA levels normalized to GAPDH were used to calculate the percentage (%) of relative infectivity with respect to F-MLV WT virus produced in the presence of empty vector. All results are presented as means ± SD. Statistical significance was determined by unpaired (two-tailed) t test for data points at 5 dpi (B and C) and by one-way ANOVA and Tukey’s test (E). ns, not significant. Results are shown for n = 3 independent experiments in panels A to E; representative immunoblotting results are shown in panels A and D. mS3, mouse SERINC3; mS5, mouse SERINC5; E.V., empty vector; gGag, glyco-Gag.

