
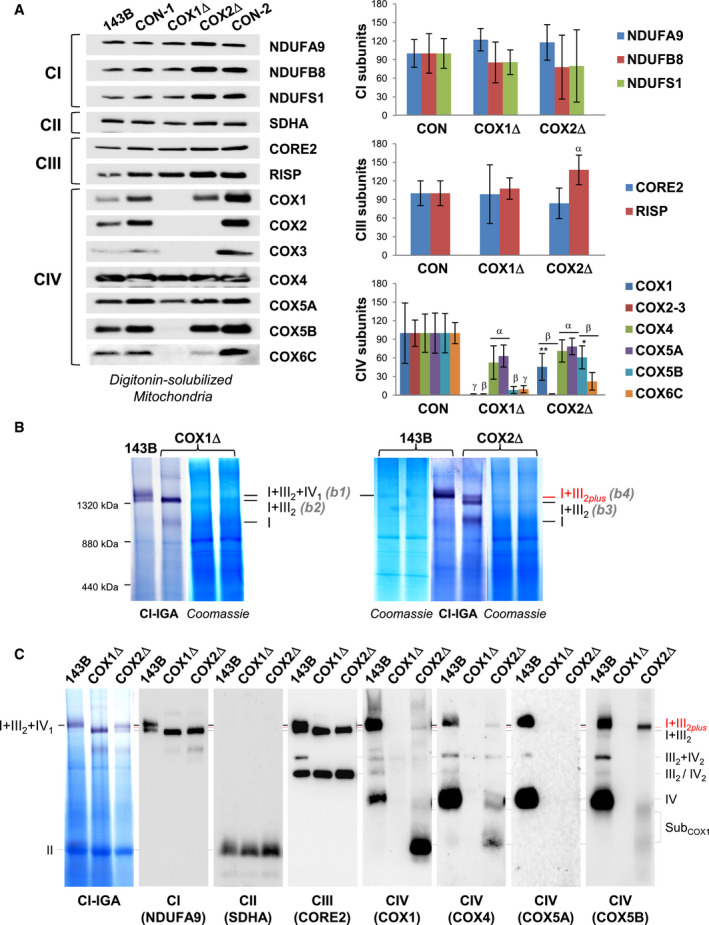
Figure 1. Mutant cybrids lacking CIV display different SC I+III2 species.
-
AMitochondrial extracts from 143B cells, and COX1Δ and COX2Δ mutant cybrids and their respective isogenic controls (CON‐1 and CON‐2) were analyzed by SDS–PAGE and immunoblotting with the indicated antibodies. The graphs (right) show densitometric quantifications of the signals normalized to CII subunit SDHA. The mean of three independent controls (CON) was set to 100, and all measurements were referenced to that value. The values represent mean ± SD (n = 3–8). Mann–Whitney U‐test was applied for statistical analyses. Variations between controls and mutants: α, P < 0.05; β, P < 0.01; and γ, P < 0.001. Specific variations between COX1Δ and COX2Δ mutants: *P < 0.05; **P < 0.01.
-
BDigitonized mitochondria (digitonin‐to‐protein ratio of 2:1) were analyzed by BN–PAGE, followed by CI in‐gel activity (IGA) assays and Coomassie staining. The SC I+III2+IV1 band (b1) was excised from the control (143B) lane, and the SC I+III2 bands (b2 to b4) were excised from the COX1Δ and COX2Δ lanes. Their protein compositions were subsequently analyzed by nano‐LC/ESI‐MS (see also Fig EV2). The relative position of the molecular weight marker is indicated on the left.
-
CBN–PAGE was followed by CI‐IGA assay and immunoblotting with the indicated antibodies (in brackets). The identity of the MRC complexes and SCs is I+III2+IV1, SC containing CI, CIII2, and CIV; I+III2, SC containing CI and CIII2; I+III2plus, SC containing CI, CIII2, and a COX1 submodule; III2+IV, SC containing CIII2 and CIV; I, complex I; III2, CIII dimer; IV2, CIV dimer; subCOX1, COX1‐containing subcomplexes.