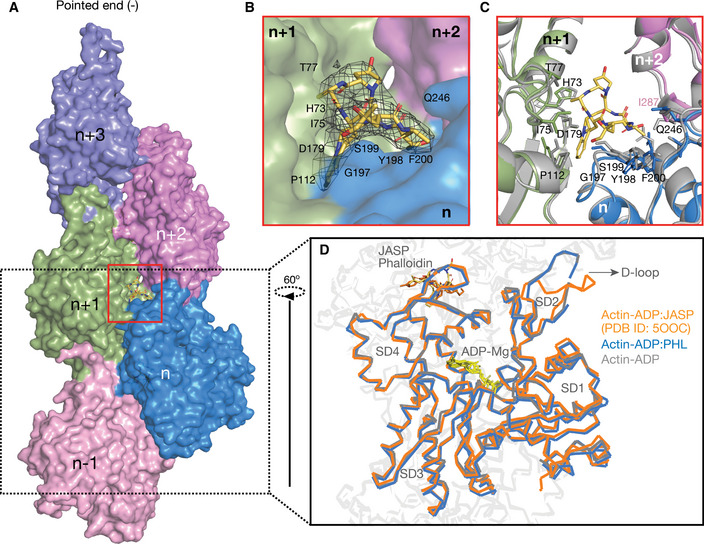
Figure 1. Phalloidin‐bound F‐actin structure resembles ADP‐actin state.

-
ASurface representation of F‐actin–ADP model, five monomers marked as n series from barbed to pointed end. A phalloidin molecule (yellow stick representation) bound between three actin monomers is highlighted.
-
BExpanded view of phalloidin‐binding pocket as marked with red box in panel (A). The density of phalloidin from EM map is shown around the ligand.
-
CComparison of phalloidin‐binding pocket residues between apo (in gray) and phalloidin bound (actin monomer colors as indicated in panel A) Key residues with their side chains and phalloidin are represented in stick representation.
-
DOverlay of F‐actin–ADP (gray), ADP/Phalloidin (blue), and ADP/Jasplakinolide (orange) shows the D‐loop conformations across different structures as indicated.
