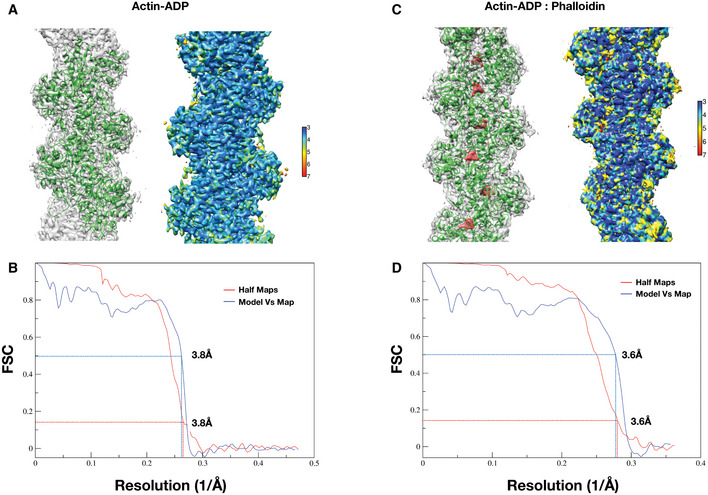
Figure EV1. F‐actin apo and phalloidin‐bound structure validation and quality control.

-
A–D(A, C) The overlay of the model (green) on the cryoEM map in gray and local resolution map of actin:ADP (apo) and actin:ADP‐phalloidin structures, respectively. The red density is the difference density of phalloidin in panel (C). (B, D) FSC plots of the half‐maps and the map versus model for the Actin–ADP and Actin–ADP–phalloidin, respectively. The resolutions were estimated based on 0.143 criteria for the half‐maps and 0.5 for the model versus map.
