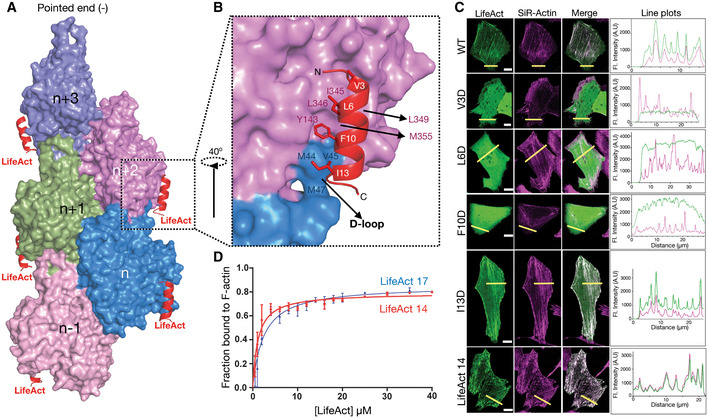
Figure 2. Interaction of lifeAct with F‐actin and mutational analysis.

-
ASurface representation of F‐actin bound to lifeAct as indicated.
-
BCartoon representation of lifeAct (red) in expanded view with n and n + 2nd actin monomers (surface representation in magenta and blue), key interacting residues are highlighted.
-
CConfocal images of U2OS cells transiently expressing lifeAct‐GFP wild‐type and mutants of lifeAct residues interacting with F‐actin, cells were additionally stained with SiR‐actin to confirm the actin filaments. The line scan as indicated with yellow line on the cells shows the extent of lifeAct (green) and SiR‐actin (magenta) co‐staining of actin structures. Scale bar = 5 μm.
-
DBinding affinities calculated from titration data of co‐sedimentation assays of lifeAct‐14 (1.2 μM) and lifeAct‐17 (2.2 μM) as indicated. Data points for each concentration were averaged from three independent experiments; error bars represent SD between independent experiments.
Source data are available online for this figure.
