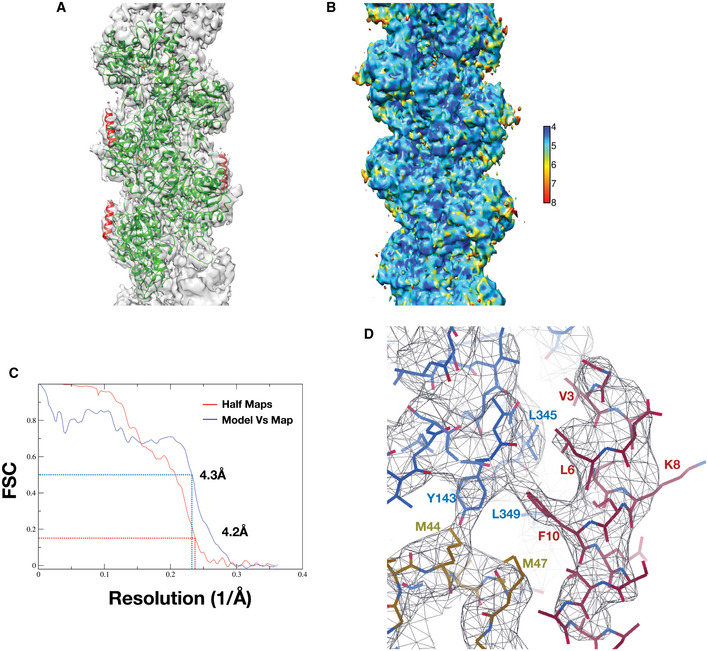
Figure EV2. F‐actin:lifeAct complex maps, structure validation and quality control.

-
AOverlay of model with map, actin, and lifeAct are colored as green and red, respectively.
-
BLocal resolution of lifeAct‐bound F‐actin map with color gradient chart determined with Resmap.
-
CFSC plots of the half‐maps (0.143) and the map versus model (0.5) for F‐actin:lifeAct structure.
-
DCloser view of lifeAct:F‐actin interaction with map, key residues marked.
