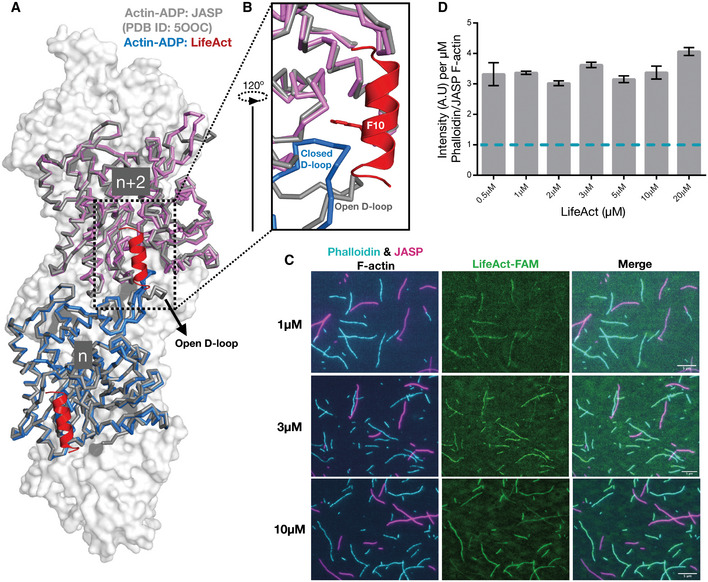
Figure 3. LifeAct recognizes the closed D‐loop state of F‐actin.

-
A, BOverlay of F‐actin:ADP‐bound LifeAct (actin in blue and magenta ribbon representation and lifeAct in red cartoon) and jasplakinolide (in gray).
-
CRepresentative TIRF images of lifeAct‐binding experiments as indicated. The remaining lifeAct concentration images are shown in Fig EV3. Scale bar = 5 μm.
-
DMean ratio of lifeAct fluorescent intensity bound to phalloidin and jasplakinolide F‐actin (mean and SEM; n = 2 or three independent experiments with > 50 actin filament for each set).
Source data are available online for this figure.
