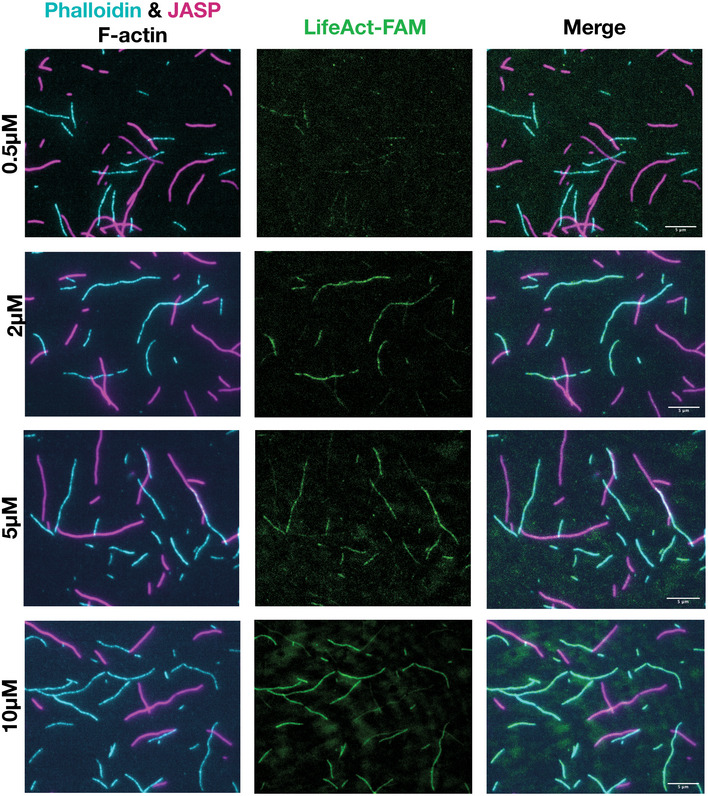
Figure EV3. TIRF images of lifeAct bound to F‐actin with phalloidin and jasplakinolide.

Representative TIRF images of lifeAct‐ versus phalloidin‐ and jasplakinolide‐bound F‐actin for concentrations as indicated. Scale bar = 5 μm.

Representative TIRF images of lifeAct‐ versus phalloidin‐ and jasplakinolide‐bound F‐actin for concentrations as indicated. Scale bar = 5 μm.