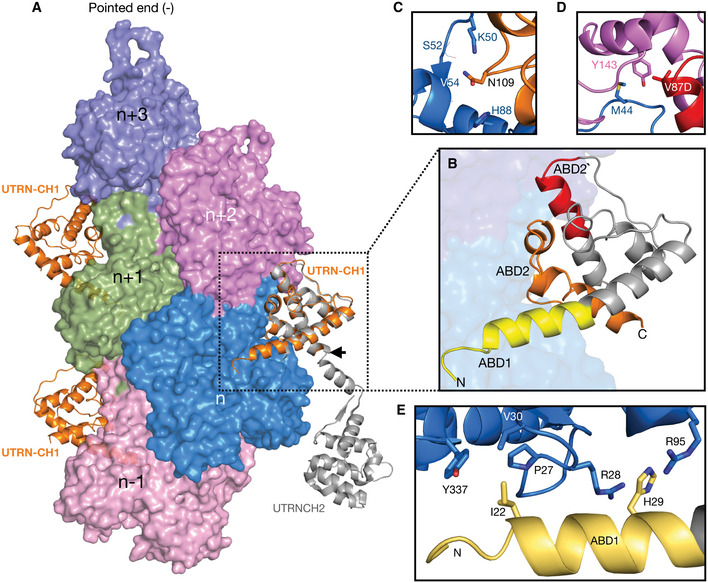
Figure 4. Utrophin CH1 domain structure and F‐actin interaction sites.

-
ASurface representation of F‐actin–ADP, five monomers marked as n series from barbed to pointed end. The utrophin CH1 domain in orange interacts with two adjacent actin monomers thus following the actin helical pattern. The crystal structure of dystrophin/utrophin in gray (1DXX) superimposed with cryoEM utrophin CH1 model, boundary of CH1 is marked by an arrow.
-
BCloser view of utrophin CH1 model, the yellow, orange, and red region depicts ABD1, ABD2, and ABD2′ sites, respectively. The ABD1 and ABD2 sites are restricted to n th actin monomer, and the ADB2` site partially interacts with the neighboring n + 2nd actin monomer.
-
C–EResidual level information of key amino acids interacting with actin monomers from ABD2: N109 (C); ABD2' site: V87 (D); and ABD1: I22, H29 (E).
