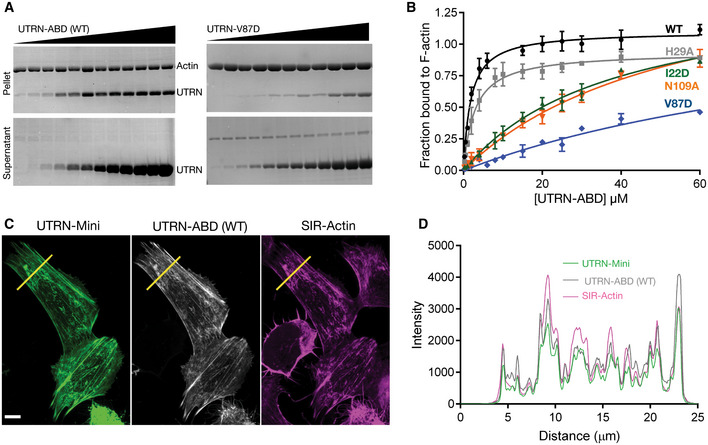
Figure 5. Mutation analysis of utrophin:F‐actin‐binding interface.

-
ARepresentative Coomassie‐stained SDS‐PAGE gels of UTRN‐ABD and UTRN‐V87D co‐sedimentation with F‐actin. Pellet (top) and supernatant (bottom) fractions of individual co‐sedimentation reactions of increasing utrophin concentrations, and uncropped gel images of all the co‐sedimentation reactions are presented in Appendix Fig S3.
-
BApparent K d indicated was calculated from the titration data of co‐sedimentation assays of utrophin wild‐type (1.8 μM) and mutants; H29A (2.8 μM), I22D (38 μM), V87D (> 100 μM), and N109A (55 μM) as indicated. Data points for each concentration were averaged from three independent experiments; error bars represent SD between independent experiments.
-
CConfocal images of U20S cells transfected with GFP tagged UTRN‐mini and mCherry‐UTRN‐ABD, stained with SIR‐Actin shows F‐actin structures, mainly stress fibers. Scale bar = 5 μm.
-
DCo‐localization analysis by intensity plot of GFP UTRN‐mini, mCherry‐UTRN‐ABD, and SiR‐Actin fluorescence using line scan of the region as indicated by the yellow line in (C).
Source data are available online for this figure.
