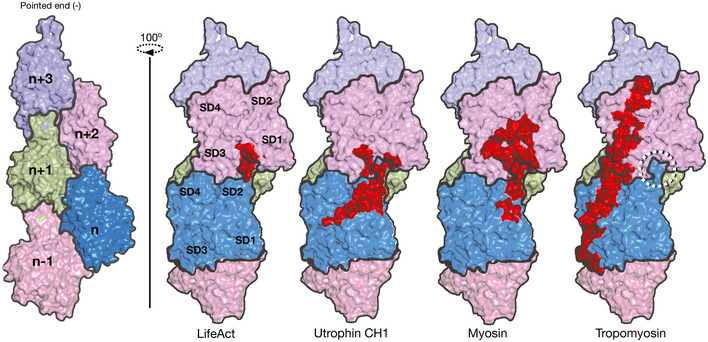
Figure 6. Interface comparison of UTRN, LifeAct with myosin, and tropomyosin.

Surface representation of F‐actin with five monomers as marked. Footprint (in red) of actin monomers and respective residues interacting with lifeAct, utrophin CH1, myosin, and tropomyosin as indicated and the D‐loop is shown circled. The myosin and tropomyosin footprints were derived from PDB IDs 6C1D and 5JLF, respectively.
