
Figure EV2. GSEA analysis of Skm iTRAQ data (BCCA catabolism). (Related to Fig 1).
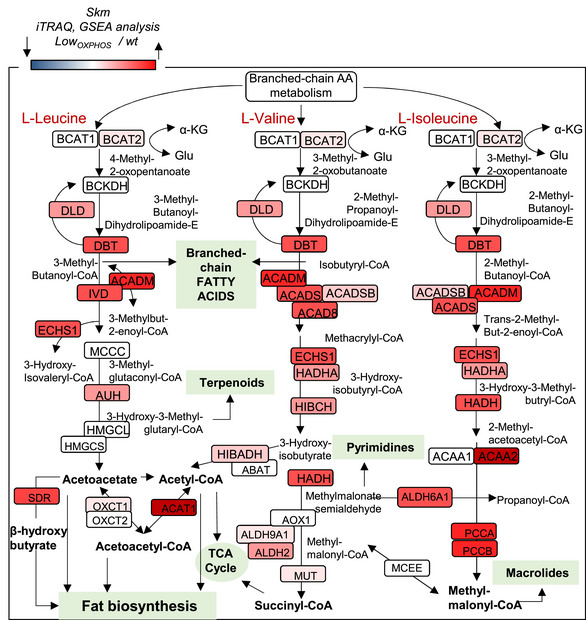
GSEA representation of the BCAA catabolism pathway obtained by the analysis of the iTRAQ data for hindlimb Skm from wt and LowOXPHOS mice. A higher intensity of red color represents a higher LowOXPHOS/wt expression ratio. Data are representative of 12 animals/genotype.