(orange bars) mice are shown.
-
A
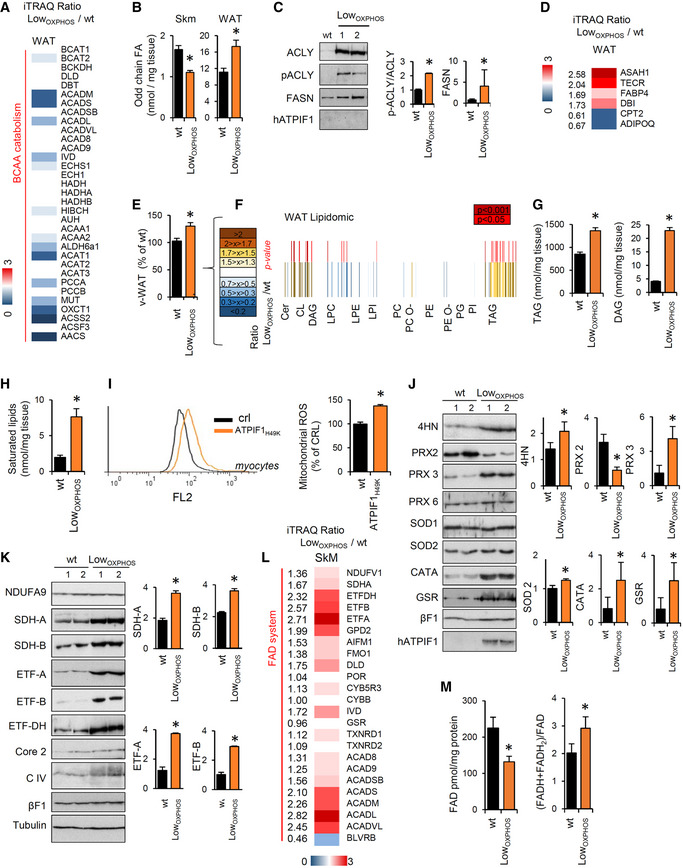
v‐WAT iTRAQ ratio of proteins from BCAA catabolism (wt, n = 4; LowOXPHOS, n = 4). Higher intensities of blue colors represent lower LowOXPHOS/wt expression ratios.
-
B
Odd chain FAs in Skm and WAT from wt (n = 8) or LowOXPHOS (n = 8) mice.
-
C, D
Representative WB expression (C) and iTRAQ analysis (D) of v‐WAT proteins from lipid metabolism. Each sample contains extracts from 3 mice. The histogram shows the quantifications (wt, n = 6; LowOXPHOS, n = 6).
-
E
v‐WAT weight expressed as a percentage of the wt (wt, n = 12; LowOXPHOS, n = 12).
-
F
Quantitative lipidomics in v‐WAT. The color scale (brown to blue) in the heat map represents LowOXPHOS/wt amounts of specific lipid species. A P‐value ≤ 0.05 was considered statistically significant (red). Each sample is a pool from 4 mouse extracts, n = 8/genotype.
-
G
v‐WAT amounts of triacylglycerides (TAGs) and diacylglycerides (DAGs) (wt, n = 8; LowOXPHOS, n = 8).
-
H
Higher saturated lipid species in LowOXPHOS mice compared to wt (wt, n = 8; LowOXPHOS, n = 8).
-
I
MitoSox staining in myocytes expressing or not ATPIF1H49K. The right histogram shows the quantification of mitochondrial ROS. Bars are the mean ± SEM of n = 3 experiments, 12 replicas/condition.
-
J
Representative WB of Skm lipid peroxidation and redox system proteins. Two samples per condition are shown. Each sample contains extracts from 3 mice. Histograms represent quantification (wt, n = 6; LowOXPHOS, n = 6). 4‐Hydroxynonenal (4HN), peroxiredoxin 2, 3 and 6 (PRX), superoxide dismutase 1 and 2 (SOD), catalase (CATA) and glutathione reductase (GSR) immunoblots are shown. βF1 is presented as a loading control.
-
K
Representative WB of Skm OXPHOS and related system proteins. Two samples
per condition are shown. Each sample contains extracts from 3 mice. Histograms represent quantification (wt,
n = 6; Low
OXPHOS,
n = 6). NDUFA9 (CI), SDHA and B (CII), ETF subunits A and B, ETFDH, CoreII (CIII), subunit 1 (CIV), βF1(CV) and hATPIF1 immunoblots are shown. Tubulin is presented as a loading control. See also Fig
EV5.
-
L
Skm iTRAQ ratio of FADH2‐binding proteins (wt, n = 12; LowOXPHOS, n = 12). A higher intensity of red color represents a higher LowOXPHOS/wt expression ratio.
-
M
Oxidized FAD levels and the reduced/oxidized FAD ratio in Skm extracts (wt, n = 8; LowOXPHOS
n = 8).
) mice/genotype. *
‐test. See also Figs
.

