
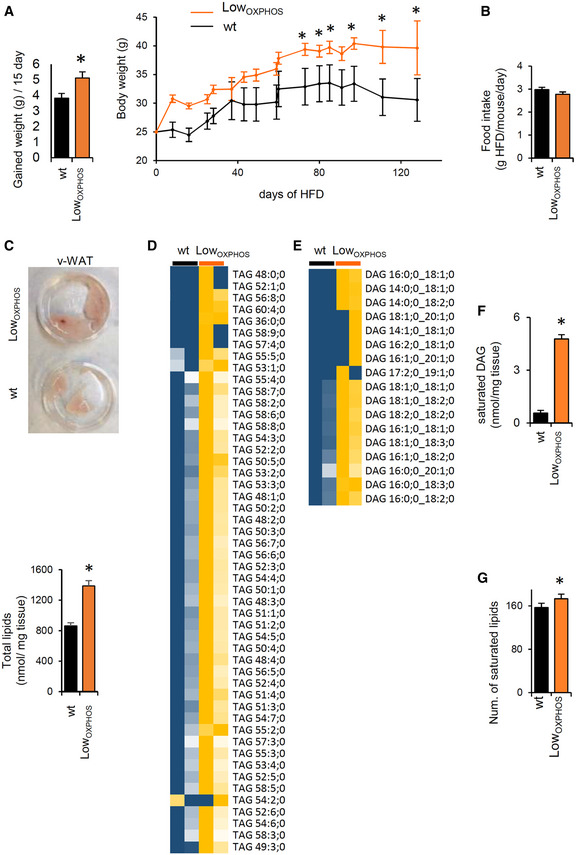
Figure EV4. HFD‐dependent alterations in lipid storages and species (related to Figs 3 and 4).
-
AWeight gained (g/15 days) and mouse body weight following the administration of HFD in wt (black bars and traces, n = 10) and LowOXPHOS (orange bars and traces, n = 10) mice.
-
BFood intake (g HFD/mouse/day) in wt (n = 5) and LowOXPHOS (n = 4) animals. No differences were observed.
-
CRepresentative images of v‐WAT in wt and LowOXPHOS mice and total lipids (nmol/mg tissue) in v‐WAT from wt (n = 8) and LowOXPHOS (n = 8) animals.
-
D, EHeat maps of the quantitative lipidomics for TAGs and DAGs species in Skm from wt (n = 8) and LowOXPHOS (n = 8) mice. The color scale (yellow to blue) in the heat map represents the z‐score.
-
F, GWAT saturated DAG (nmol/mg tissue, F) and Skm number of saturated lipid species (G); wt, n = 8; LowOXPHOS, n = 8.