-
A
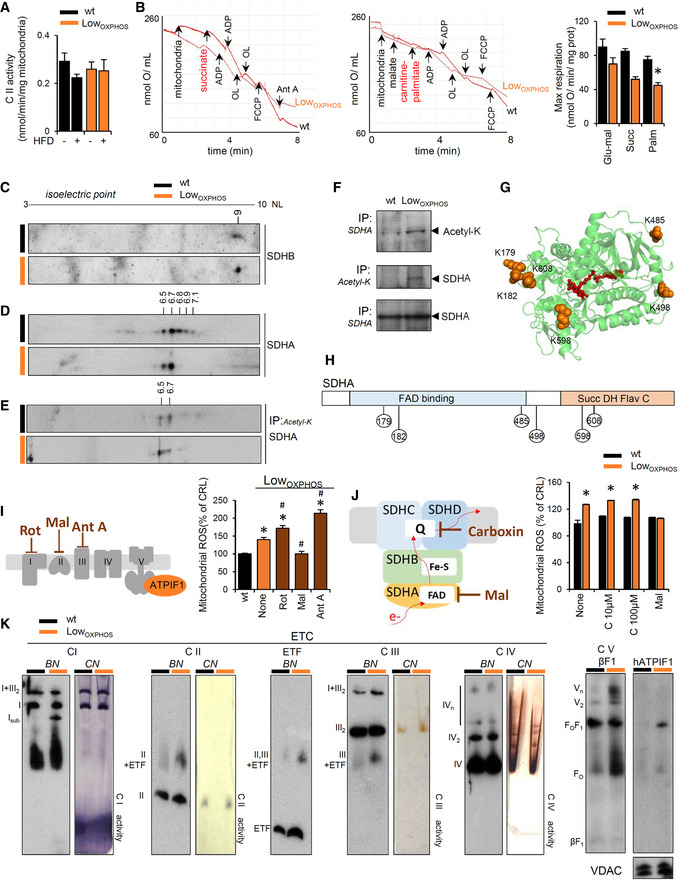
Enzymatic activity of respiratory complex CII in Skm isolated mitochondria from wt and LowOXPHOS mice fed with chow or HFD (wt, n = 4; LowOXPHOS, n = 4; wt + HFD, n = 4; LowOXPHOS + HFD, n = 4).
-
B
Polarographic profiles of isolated mitochondria from wt (lower trace) and LowOXPHOS (upper trace) animals using succinate (left graph) or palmitoyl‐carnitine (right graph) as a substrate. Quantification of maximal respiration in the right histogram. Bars are the mean ± SEM of n = 3 mice/genotype, 3 traces/mouse; OL, oligomycin; Ant A, antimycin A.
-
C–E
2D‐PAGE of Skm extracts (C, D) and acetylated proteins (E) from wt (n = 4) and LowOXPHOS (n = 3) mice. The isoelectric point (pI) of the CII subunits SDHB (C) and SDHA (D) was calculated by protein migration in pH 3–10 NL strips.
-
F
Immunocapture (IP) of SDHA blotted with anti‐acetyl‐K antibody (upper panel) and of acetylated proteins blotted with anti‐SDHA antibody (middle panel) in Skm isolated mitochondria from wt (n = 3) and LowOXPHOS (n = 3) mice.
-
G, H
PyMOL cartoon representations of acetylated lysines in SDHA related to CII activity. Six acetylated‐K are shown.
-
I
MitoSox staining in myocytes expressing or not ATPIF1H49K. The left scheme illustrates where each ETC inhibitor works. The right histogram shows the quantification of mitochondrial ROS. Bars are the mean ± SEM of n = 3 experiments, 12 replicas/condition.
-
J
MitoSox staining in myocytes expressing or not ATPIF1H49K. The left scheme illustrates where each CII inhibitor works. The right histogram shows the quantification of mitochondrial ROS. Bars are the mean ± SEM of n = 3 experiments, 12 replicas/condition.
-
K
Representative blue‐native immunoblots (BN) and clear‐native in‐gel activity (CN) of Skm mitochondrial membrane proteins from wt (n = 3) and LowOXPHOS (n = 3) 2‐month‐old mice. The migration of the respiratory complexes/supercomplexes CIV is indicated. Subassembly of CI (with no activity, suggesting degradation) was observed in LowOXPHOS mice. VDAC is shown as a loading control.
‐test. See also Fig
.

