-
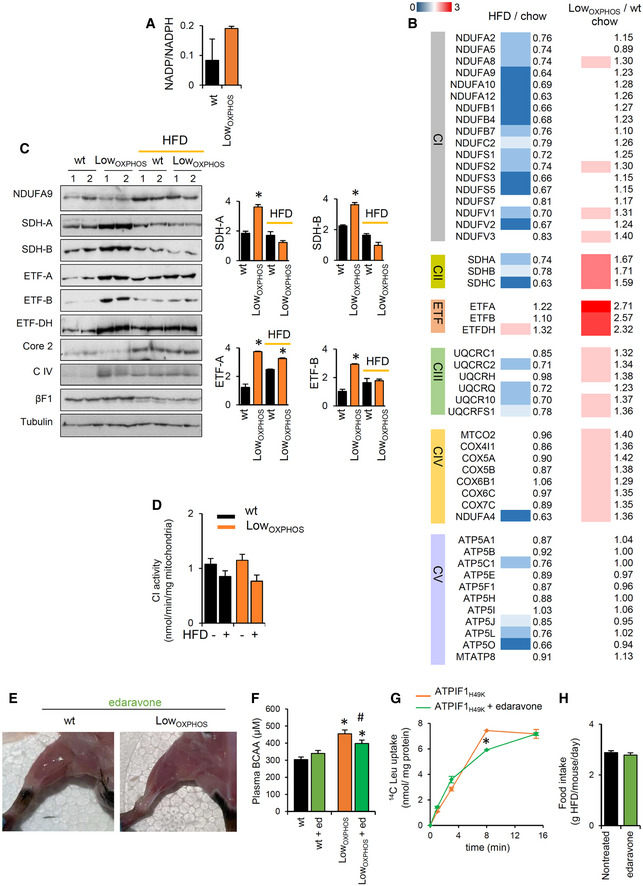
A
NADP/NADPH levels in Skm extracts from wt (n = 8) and LowOXPHOS (n = 8) animals.
-
B
HFD/chow and LowOXPHOS/wt iTRAQ ratios of Skm proteins from OXPHOS system (wt, n = 10–12; LowOXPHOS, n = 10–12). Higher intensities of red or blue color represent higher or lower expression ratios, respectively. HFD induced the downregulation of the majority of OXPHOS complex subunits.
-
C
Representative WB of Skm OXPHOS system proteins in mice fed with chow or HFD. Two samples per condition are shown. Each sample contains extracts from 3 mice. NDUFA9 (CI), SDHA and B (CII), ETF subunits (A) and (B), ETFDH, CoreII (CIII), subunit 1 (CIV), βF1(CV), and hATPIF1 immunoblots are shown. Tubulin is provided as a loading control. Histograms show the quantification of specific protein expression (wt, n = 6; LowOXPHOS, n = 6; wt + HFD, n = 6; LowOXPHOS + HFD, n = 6).
-
D
Enzymatic activity of respiratory complex CI in Skm isolated mitochondria from wt and LowOXPHOS mice fed with chow or HFD (wt, n = 4; LowOXPHOS, n = 4; wt + HFD, n = 4; LowOXPHOS + HFD, n = 4).
-
E
Representative images of hindlimb muscles of mice treated with edaravone (wt + edaravone, n = 4; LowOXPHOS + edaravone, n = 4).
-
F
Plasma BCAA levels in wt and LowOXPHOS mice treated or not with edaravone (wt, n = 4; LowOXPHOS, n = 4; wt + edaravone, n = 4; LowOXPHOS + edaravone, n = 4).
-
G
14C(u)‐leucine uptake in myocytes expressing ATPIF1H49K treated or not with edaravone. Data are the mean ± SEM of n = 3 experiments, 6 replicas/condition.
-
H
Food intake (g HFD/mouse/day) in wt and LowOXPHOS animals treated or not with edaravone (wt, n = 5; wt + edaravone, n = 5). No differences were observed.
) mice. *
‐test.