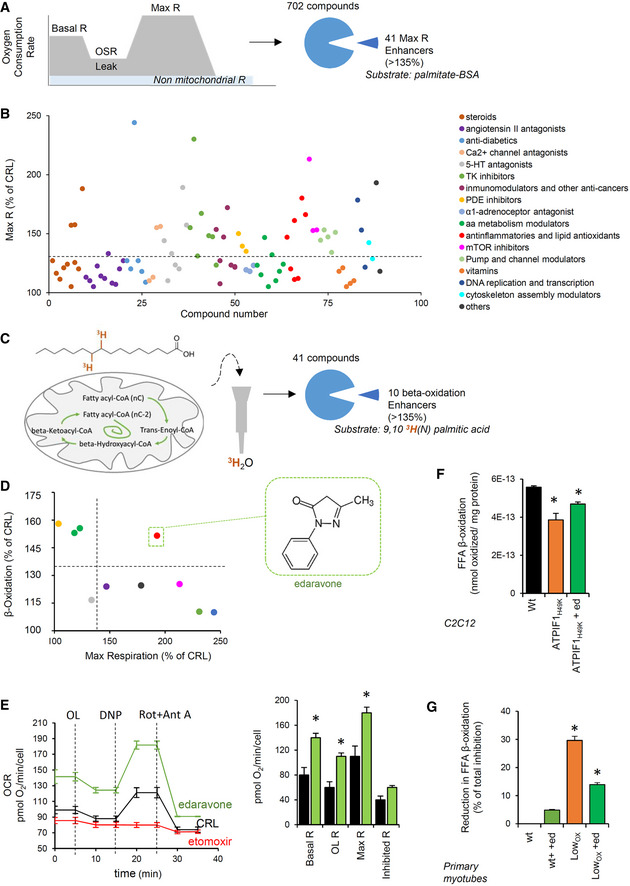
Figure 6. Edaravone as a mitochondrial metabolism enhancer.

-
A, BThe schematic illustrates the screening process of 702 drugs related to the mitochondrial respiratory capacity assessed by Seahorse XFe96 in C2C12 myocytes. Palmitate is used as a substrate. A total of 41 hits were identified. Maximum respiration (Max R, % of untreated cells) of compounds categorized by their therapeutic use (B).
-
C, DThe schematic illustrates the screening process of the 41 hits on FFA β‐oxidation using 9,103H(N) palmitic acid as a substrate in C2C12 myocytes. Ten enhancers were identified. (D) Correlation between the maximum respiration (x) and palmitate β‐oxidation (y). Colors identify classes of pharmaceuticals as in (B). Edaravone was selected as a hit.
-
ERepresentative respiratory profile of C2C12 myocytes treated (green trace) or not treated (black trace) with 2 μM edaravone. The CPT1 inhibitor etomoxir was used as a negative control. OCR, oxygen consumption rate; OL, oligomycin; DNP, 2,4‐dinitrophenol; Rot, rotenone; Ant A, antimycin A. Quantification in right histogram. Bars are the mean ± SEM of 12 replicas/condition.
-
F, GFFA β‐oxidation in C2C12 myocytes transfected with CRL or ATPIF1H49K plasmids (F) and in primary myotubes from wt and LowOXPHOS mice (G), treated (green bars) or not with 2 μM edaravone. Bars are the mean ± SEM of n = 3 experiments, 9 replicas/condition.
