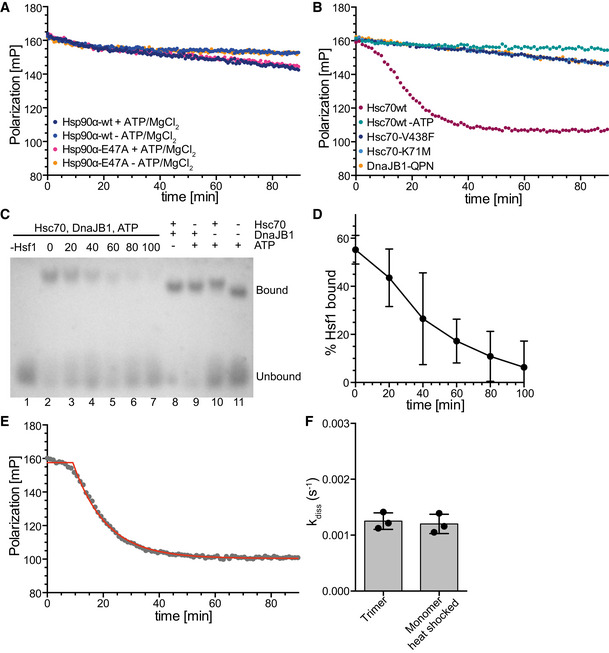
Figure EV1. Hsc70 dissociates Hsf1 from DNA.

- Hsp90α wild type or ATP hydrolysis deficient Hsp90α‐E47A do not influence Hsf1 DNA binding. Trimeric Hsf1 was bound to Alexa Fluor® 488‐labeled HSE‐DNA and the indicated components added at timepoint 0. A representative experiment is shown.
- Hsc70's ability to hydrolyze ATP and to bind to polypeptides, and stimulation of Hsc70's ATPase activity by DnaJB1 are essential for dissociation of DNA‐bound Hsf1. Hsc70‐K71M, ATPase deficient; Hsc70‐V438F, reduced affinity for polypeptides; DnaJB1‐H32Q,D34N (DnaJB1‐QPN), defective in stimulation of Hsc70's ATPase activity.
- Hsc70/DnaJB1‐mediated dissociation of Hsf1 from HSE‐DNA analyzed by electrophoretic mobility shift assay. Trimeric Hsf1 was bound to Cy3‐labeled HSE‐DNA and the indicated components added at timepoint 0. The reaction mixture was separated on a 1% agarose gel. Lane 1, Cy3‐labeled HSE‐DNA without Hsf1 in the presence of Hsc70, DnaJB1, and ATP; lanes 2 to 7; dissociation reaction after 0‐ to 100‐min incubation; and lanes 8 to 11, dissociation reaction with missing components after 100‐min incubation.
- Quantification of EMSA shown in (C) and two similar EMSAs. Shown are mean ± SD (n = 3).
- Non‐linear regression analysis of the representative data shown in Fig 1D (magenta dots, shown here in gray). The red line represents the fit of the composite equation with y max and y 0 signifying the fitted maximal and minimal fluorescence polarization values and k being the rate of the dissociation reaction, to these exemplary data.
- The dissociation rate did not differ, if Hsf1 purified as a trimer from E. coli without prior heat shock, or monomeric Hsf1 heat shocked for 10 min at 42°C, was used for the reaction. Shown are mean ± SD (n = 3).
Source data are available online for this figure.
