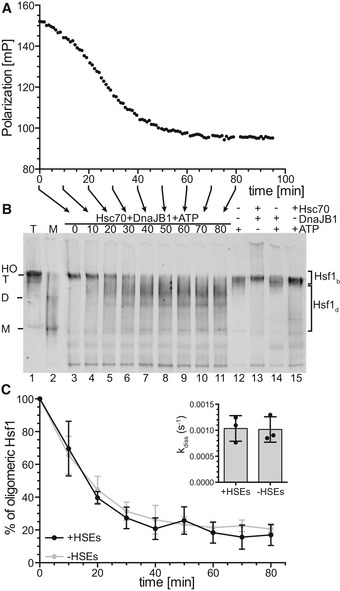
Figure 2. Hsc70 and DnaJB1 dissociate Hsf1 from HSE‐DNA by monomerization of the Hsf1 trimer.

-
A, BStandard Hsc70/DnaJB1‐mediated dissociation reaction of Hsf1 from Alexa Fluor® 488‐labeled HSE‐DNA similar to Fig 1D monitored by fluorescence polarization (A). The same reaction mixture was incubated for different time intervals as indicated by the arrows below the x‐axis, and the reaction stopped by addition of blue‐native loading buffer, and stored on ice until separation by blue‐native PAGE, blotted onto a PVDF membrane, and detected with an Hsf1‐specific antiserum (B). Lanes 1, purified Hsf1 trimer (T); 2, purified Hsf1 monomer (M); 3–11, samples from the Hsc70/DnaJB1‐mediated Hsf1 dissociation reaction (0–80 min); and 12–15, dissociation reaction incubated for 80 min missing individual components as indicated. HO, higher order oligomers; T, trimer; D, dimer; M, monomer.
-
CQuantification of the amounts of Hsf1 species of the blot shown in (B) and five similar blots. For each lane, the intensities of the two areas indicated by the brackets to the right were integrated; upper bracket, DNA‐bound timers and higher order oligomers (Hsf1b); lower bracket, monomers and Hsf1‐species possibly bound by Hsc70 or DnaJB1 or both dissociated from DNA (Hsf1d). Shown are means ± SD (n = 3). Inset, deoligomerization rate as determined by fitting an exponential decay function to the data. Shown are means ± SD (n = 3).
Source data are available online for this figure.
