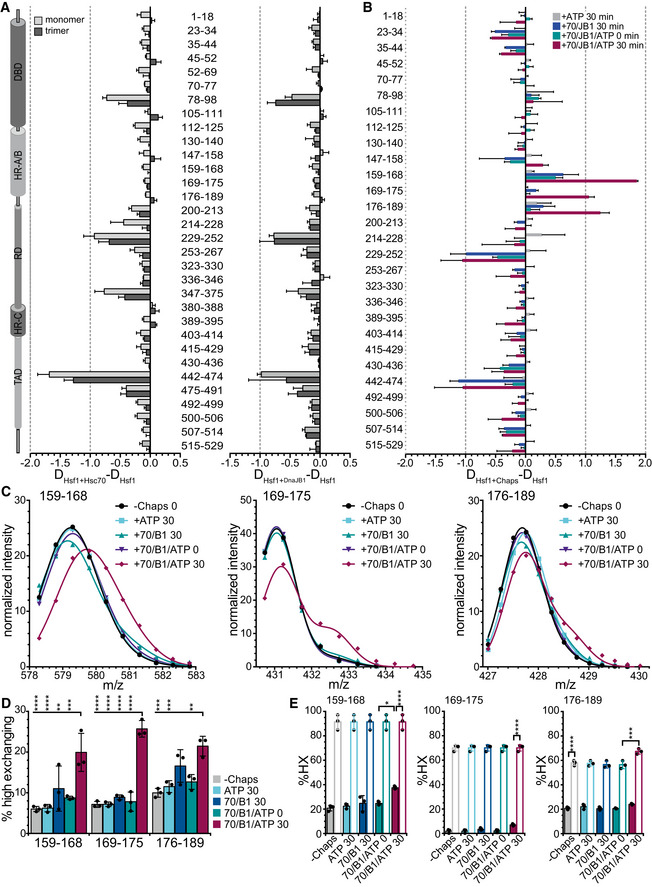
Figure 3. Hsc70 and DnaJB1 interaction with Hsf1 trimers lead to deprotection of segments within the trimerization domain.

- Difference plot of deuteron incorporation into Hsf1 monomers (light gray) or trimers (dark gray) in the presence of Hsc70 (left) or DnaJB1 (right) minus deuteron incorporation into Hsf1 in the absence of chaperones after 30 s incubation in D2O buffer. Shown are mean ± SD (n = 3) for peptic peptides as indicated between the panels. Left, Hsf1 domain representation. (see also Appendix Fig S1).
- Difference plot of deuteron incorporation into Hsf1 trimers incubated for 300 s in D2O buffer after pre‐incubation in the presence of ATP, Hsc70 (70), and DnaJB1 (B1) as indicated minus deuteron incorporation into Hsf1 in the absences of additives. For relative deuteron incorporation, see Appendix Fig S2A. Shown are means ± SD (n = 3).
- Fit of two Gaussian distributions to the peak intensities for peptic peptides 159–168 (left), 169–175 (middle), and 176–189 (right). Representative plots of three independent experiments. Original spectra and individual Gaussian distributions are shown in Appendix Fig S2B and C.
- Fraction of high exchanging subpopulation for peptides 159–168, 169–175, and 176–189 under the different indicated pre‐incubation conditions: ‐chaperones, +Hsc70 (70), +DnaJB1 (B1), and +ATP incubated for 0 or 30 min at 25°C. Shown are means ± SD (n=3). Statistical analysis: ANOVA with Sidak's multiple comparison of different conditions for each of the peptides; **P < 0.01; ***P < 0.001, ****P < 0.0001.
- Relative deuteron incorporation of the low (solid bars) and high (open bars) exchanging subpopulations. Shown are means ± SD (n = 3). ANOVA, Sidak's multiple comparison test; *P < 0.05; ***P < 0.001; ****P < 0.0001.
