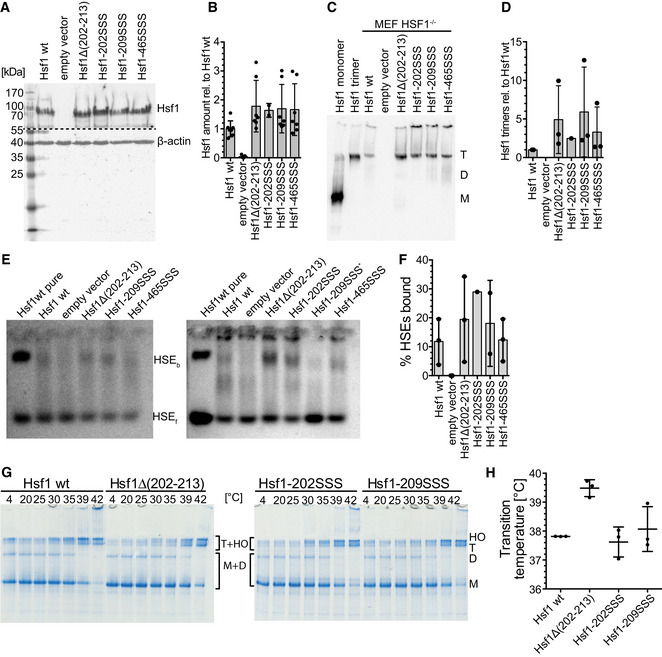
Figure EV3. Wild‐type Hsf1 and mutant Hsf1 are expressed to the same levels in transfected HSF1−/− MEFs and form trimers in cultured cells that are able to bind to DNA.

- Cell lysates of HSF1−/− MEFs transfected with constructs encoding the indicated proteins were separated by SDS–PAGE and blotted onto PVDF membranes, and Hsf1 and β‐actin were detected using specific antisera. Before the immune detection, the blot was cut at the dashed line. Representative blot of three independent transfection experiments is shown.
- Quantification of the blot shown in (A) and similar blots. No significant differences between wild‐type and mutant proteins were detected (ANOVA, Sidak's multiple comparison). Shown are mean ± SD (n = 7, except for Hsf1‐202SSS: n = 2).
- Cell lysates of HSF1−/− MEFs transfected with constructs encoding the indicated proteins were separated by BN‐PAGE and blotted onto PVDF membranes, and Hsf1 was detected using specific antisera. As a control, purified monomeric and trimeric Hsf1 was loaded in lanes 1 and 2. M, monomer. D, dimer. T, trimer.
- Quantification of blot shown in (C) and similar blots. Shown are mean ± SD (n = 3, except for Hsf1‐202SSS, for which a single experiment is shown)
- Electrophoretic mobility shift assay detects DNA binding of Hsf1 in cell lysate. Cell lysates of HSF1−/− MEFs transfected with constructs encoding the indicated proteins were incubated with Cy3‐labeled HSE‐DNA and separated on 1% agarose gels. Hsf1 bound (HSEb) and free (HSEf) DNA were detected by fluorescence scanning. EMSAs of two of three independent transfection experiments are shown. *, due to increased cell death, lysate of MEFs transfected with Hsf1‐209SSS encoding plasmid was not concentrated enough, and HSE‐DNA was only incubated with less than half the protein concentration as compared to the other samples; this lane was therefore not quantified.
- Quantification of EMSAs shown in (E) and additional ones. Mean ± SD are shown (n = 3, except for Hsf1‐209SSS: n = 2 and Hsf1‐202SSS: n = 1).
- Hsf1 variants with mutations in the HR‐B proximal Hsc70 binding site do not trimerize at lower transition temperatures. Purified monomeric Hsf1 wild‐type and mutant proteins were incubated for 10 min at 4–42°C as indicated and subsequently separated by BN‐PAGE.
- Monomer (M), dimer (D), trimer (T), and higher order oligomer (HO) bands of three independent experiments were quantified, and the equation for the thermal unfolding transition fitted to the data. The graph shows the melting temperature ± SD (n = 3).
Source data are available online for this figure.
