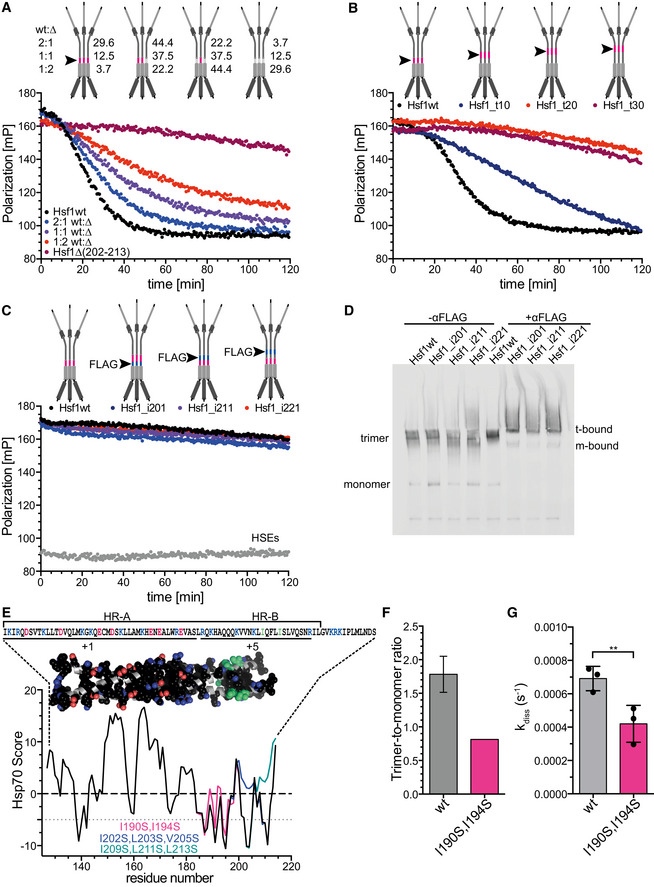
Figure 5. Hsc70/DnaJB1 monomerize Hsf1 by cycles of successive entropic pulling.

- The rate of Hsc70/DnaJB1‐mediated dissociation of HSE‐DNA‐bound Hsf1 depends on the number of HR‐B proximal Hsc70 binding sites in the Hsf1 trimer. Hsf1wt (wt) and Hsf1∆(202–213) (∆) monomers were mixed in the indicated ratios and heat shocked at 42°C for 10 min to form mixtures of different homo‐ and heterotrimers as indicated with the cartoons (the red line and the arrowhead indicate the Hsc70 binding site). Numbers indicate the relative fraction of the different species. For fit of the data, see Fig EV2.
- Moving the Hsc70 binding site away from the trimerization domain reduces the rate of Hsc70/DnaJB1‐mediated dissociation of HSE‐DNA‐bound Hsf1. Hsf1_t10/20/30, region 202–213 moved by 10, 20, or 30 residues toward the C‐terminus.
- Anti‐FLAG antibodies are not able to dissociate HSE‐DNA‐bound Hsf1. Red lines in the cartoon indicate the Hsc70 binding site; blue lines and arrowhead indicate the inserted FLAG epitope DYKDDDDK. Hsf1_i201/211/221, FLAG epitope inserted after residue 201, 211, or 221. Anti‐FLAG antibodies were split in halfmers by incubation with 2 mM DTT (see Appendix Fig S3).
- Anti‐FLAG antibody halfmers bound to FLAG epitope containing Hsf1 variants. Hsf1wt and FLAG‐insertion variants were analyzed by blue‐native gel electrophoresis in the absence or presence of DTT‐treated anti‐FLAG antibodies as indicated and Hsf1 detected by immunoblotting; t‐bound, FLAG antibody‐bound Hsf1 trimers; m‐bound, FLAG antibody‐bound Hsf1 monomers.
- Predicted Hsc70 binding sites in the trimerization domain of Hsf1. Hsp70 score of the trimerization region residues 130–216 of Hsf1wt, black; Hsf1‐I190S,I194S, magenta; Hsf1‐I202S,L203S,V205S, blue; and Hsf1‐I209S,L211S,L213S, green. Values below −5 are considered good Hsc70 binding sites. Above the graph is the trimeric homology model of the trimerization domain residues 130–203 with side chains of hydrophobic and charged residues in space‐filling representation in atom colors with carbon in black except for Ile190 and Ile194 where carbon is shown in green. Above the model is the corresponding sequence. Positively charged residues, blue; negatively charged residues, red. Lines below the sequence indicate two distinct regions with net charge +1 and +5.
- Trimer‐to‐monomer ratio of freshly purified Hsf1wt and Hsf1‐I190S,I194S in the absence of heat shock, determined by gel filtration and BN‐PAGE (see Appendix Fig S4). Hsf1wt, mean ± SD (n = 3).
- Rate of Hsc70/DnaJB1‐mediated dissociation of HSE‐DNA‐bound Hsf1wt and Hsf1‐I190S,I194S; mean ± SD (n = 3); **, P < 0.01; (paired t‐test).
Source data are available online for this figure.
