-
A
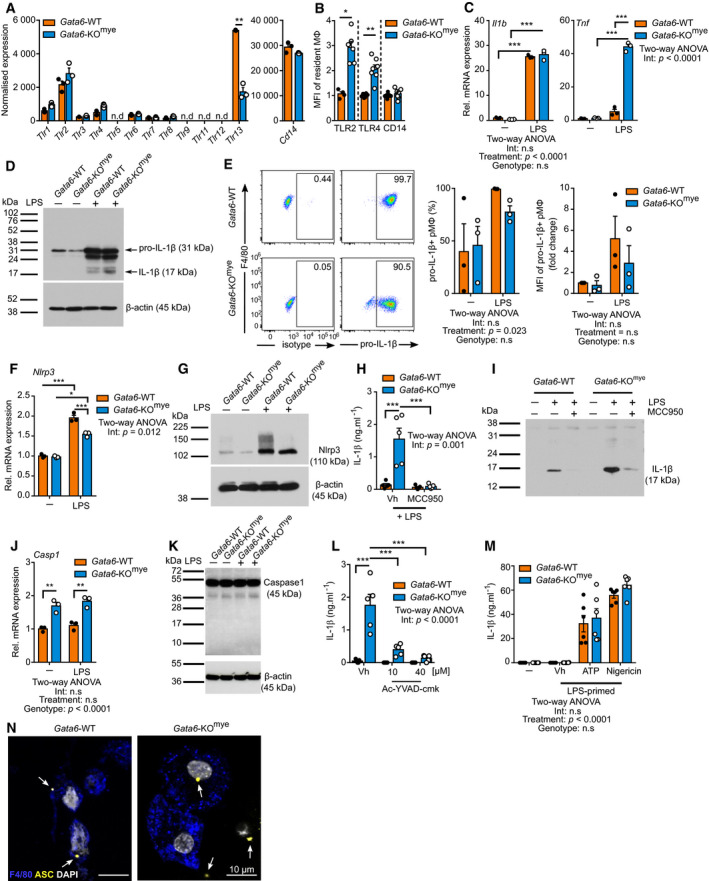
Normalized expression of Tlr and Cd14 genes following microarray analysis performed on unstimulated cell‐sorted Gata6‐WT and Gata6‐KOmye pMФ. Data are shown as mean ± SEM from three biological replicates. Statistical significance was determined using empirical Bayesian statistic corrected for false discovery rate by the Benjamini–Hochberg procedure. n.d = non‐detectable.
-
B
Mean fluorescence intensity (MFI) of extracellular TLR2, TLR4 and CD14 expression on naïve Gata6‐WT and Gata6‐KOmye pMФ. n = 4–7 individual mice per group.
-
C, D
Il1b and Tnf mRNA relative expression (C) and IL‐1β Western blot protein analysis (D) of Gata6‐WT and Gata6‐KOmye pMФ stimulated with 100 ng/ml LPS for 3 and 6 h respectively. Data shown are representative of at least three independent experiments. Western blot was performed on whole cell lysates.
-
E
Representative dot plot, percentage and mean fluorescence intensity (MFI) analysis of pro‐IL‐1β+ Gata6‐WT and Gata6‐KOmye pMФ flow cytometry analysis 3 h after stimulation with 100 ng/ml LPS. n = at least three independent experiments.
-
F
Nlrp3 mRNA relative expression of Gata6‐WT and Gata6‐KOmye pMФ stimulated with 100 ng/ml LPS for 3 h. Data shown are pooled from three independent experiments.
-
G
Western blot protein analysis of Gata6‐WT and Gata6‐KOmye pMФ stimulated with 100 ng/ml LPS for 6 h. Data shown are representative of at least three independent experiments. Western blot was performed on whole cell lysates.
-
H, I
IL‐1β ELISA (H) and Western blot protein analysis (I) of supernatants collected from Gata6‐WT and Gata6‐KOmye pMФ stimulated with 100 ng/ml LPS and either vehicle control (Vh, DMSO) or 10 μM MCC950 for 24 h (n = 5). Data shown in (H) are pooled from five independent replicates.
-
J, K
Caspase1 (Casp1) mRNA relative expression (J) and Western blot protein analysis (K) of Gata6‐WT and Gata6‐KOmye pMФ stimulated with 100 ng/ml LPS for 3 and 6 h respectively. Data shown are pooled from three independent experiments.
-
L
IL‐1β ELISA of Gata6‐WT and Gata6‐KOmye pMФ stimulated with 100 ng/ml LPS and either vehicle control (Vh, DMSO) or Ac‐YVAD‐cmk for 24 h. Data shown are pooled of five independent replicates.
-
M
IL‐1β ELISA of Gata6‐WT and Gata6‐KOmye pMФ stimulated with 100 ng/ml LPS for 3 h, followed by a 30 min pulse with either vehicle control (Vh), 5 mM ATP or 20 μM nigericin. Data shown are pooled of five independent replicates.
-
N
Representative picture of confocal immunofluorescence analysis of Gata6‐WT and Gata6‐KOmye pMФ stimulated with 100 ng/ml LPS for 3 h, followed by a 30 min pulse with 5 mM ATP. The white arrows show ASC specks. Scale bar = 10 μm.
Data information: Data are expressed as mean ± SEM and analysis were performed using two‐way ANOVA analysis Tukey's multiple comparison post‐test unless otherwise stated. *
< 0.001.

