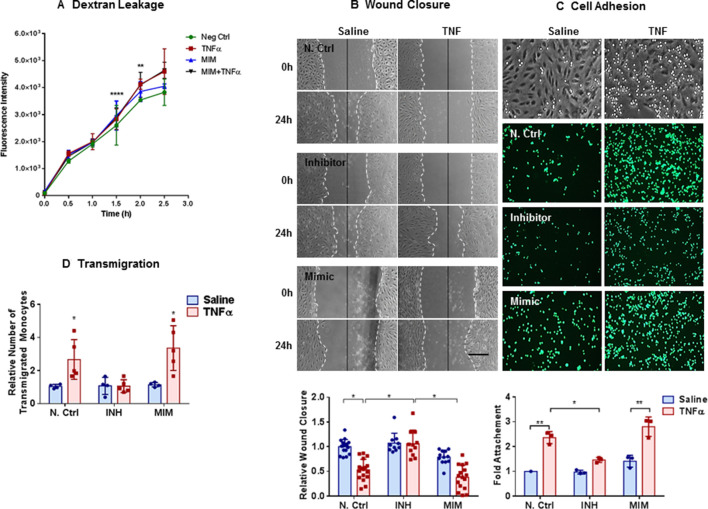
Figure 4.
Inhibition of miR-27a-5p enhances wound healing and mitigates tumour necrosis factor (TNF)-induced cell adhesion and transmigration: (A) change in fluorescent intensity showing dextran leakage across human pulmonarymicrovascular endothelial cell (HPMEC) monolayers. HPMECs were seeded onto 0.2% gelatin-coated 8-µm-pore Transwell inserts and transfected with either negative control (NC) or miR-27a-5p mimic (MIM); 24 hours later monolayers were treated with TNF (10 ng/mL) or saline for 24 hours. The following morning FITC-labelled dextran (70 KDa) was added to the upper chamber and the fluorescence of the lower chamber was measured every 30 min for 3 hours. Bar graphs show fluorescence intensity means±SDs for individual experiments normalised to NC Ctrl at time 0. Peak differences in dextran leakage between NC and TNF and MIM+TNF are seen at 1.5 hours (for normally distributed data, two-way analysis of variance (ANOVA), Tukey’s correction for multiple comparisons, **p≤0.01 and ****p≤0.0001). (B) Representative photomicrographs from experiments showing wound closure in HPMECs. HPMECs were transfected with NC, miR-27a-5p inhibitor (INH) or miR-27a-5p MIM and 24 hours later a single scratch was made straight down the middle of the monolayer and TNF (10 ng/mL) or saline was added. Micrographs from one representative experiment is shown (n=4). Distance between the leading edges was measured and bar graph show relative change in mean wound closure±SD. Scale bars are 50 mm. (C) Representative micrographs from experiments showing inhibition of THP-1 monocyte adhesion to the TNF-activated HPMECs by miR-27a-5p inhibitor (n=3). HPMECs transfected with MIM and INH and treated with TNF as described above. The following morning, THP-1 monocytes were labelled with 2 µM of CellTracker Green 5-chloromethylfluorescein diacetate and 5×10⁵ labelled monocytes (in RPMI-1640 medium) were added to each well and allowed to attach to the monolayer for 30 min. After washing, cell adhesion was determined by measuring fluorescence (excitation/emission of 492/517 nm). Bar graph shows mean fold change in cell attachment ±SD. (D) Transendothelial migration assay. HPMECs grown in Transwell inserts as above were transfected with miR-27a-5p MIM, INH or N Ctrl and exposed to TNF as above. The following morning, HPMECs were washed, and monocyte chemoattractant protein-1 (10 ng/mL) was added to the lower chamber. Fluorescently labelled THP-1 monocytes were added to the upper chamber and cells were allowed to migrate for 2 hours. Transwells were then removed and fluorescent images of the lower chamber taken. Cells were counted for calculation of relative transmigration (n=4–5). Bar graph show relative number of transmigrated monocytes. All data are normally distributed (Kolmogorov-Smirnov test) and presented as means±SDs (*p≤0.05, **p≤0.01, two-way ANOVA, Tukey correction for multiple comparisons).

