-
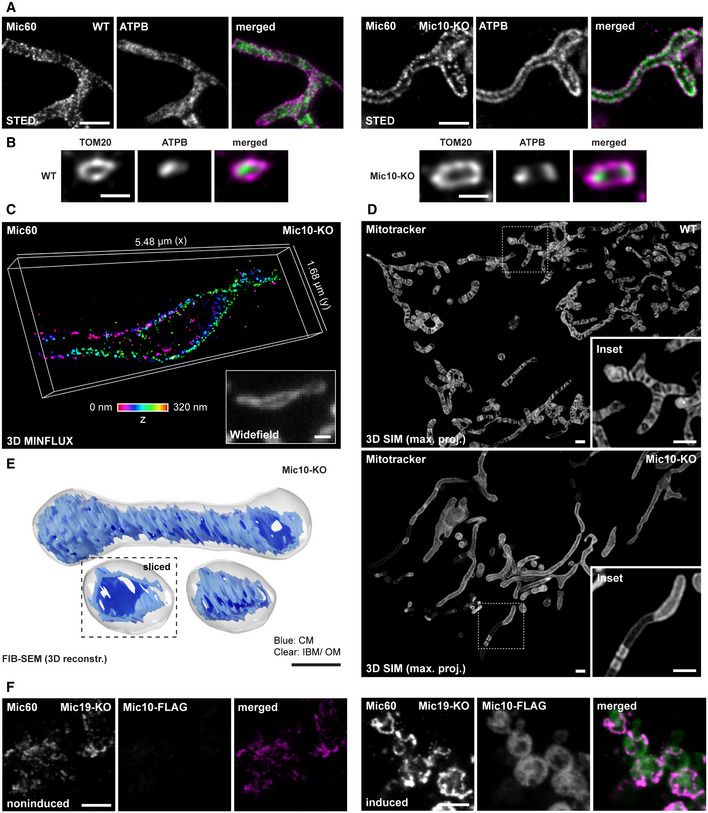
A, B
Nanoscopy of mitochondria of WT and Mic10‐KO cells, as indicated. (A) Mitochondria were immunolabeled for Mic60 and ATPB and visualized by 2D STED nanoscopy. (B) Mitochondria were immunolabeled for TOM20 and ATPB and recorded with 3D STED nanoscopy. Image data were deconvolved. Depicted are cross sections of a mitochondrion (side view).
-
C
3D MINFLUX nanoscopy. Mic10‐KO cells were immunolabeled for Mic60 using a directly labeled antibody. Colors encode depth information.
-
D
3D SIM of living WT and Mic10‐KO cells. Cells were labeled with Mitotracker Green. Images show maximum intensity projections.
-
E
FIB‐SEM of Mic10‐KO cells. Shown is a representative reconstructed mitochondrion. Dashed box: Orthoslice view on the smaller mitochondrion. The OM and IBM are displayed together in clear gray, the CM in is shown in blue.
-
F
2D STED nanoscopy of mitochondria. Mic19‐KO cells were transfected with a plasmid for Mic10‐FLAG expression under the control of a tetracycline‐inducible promoter. Left panel: Mitochondria from noninduced cell. Right: Mitochondria from induced cell expressing Mic10‐FLAG.
Data information: Scale bars: 1 μm (A, C, D, F), 500 nm (B, E).

