
Figure 1.
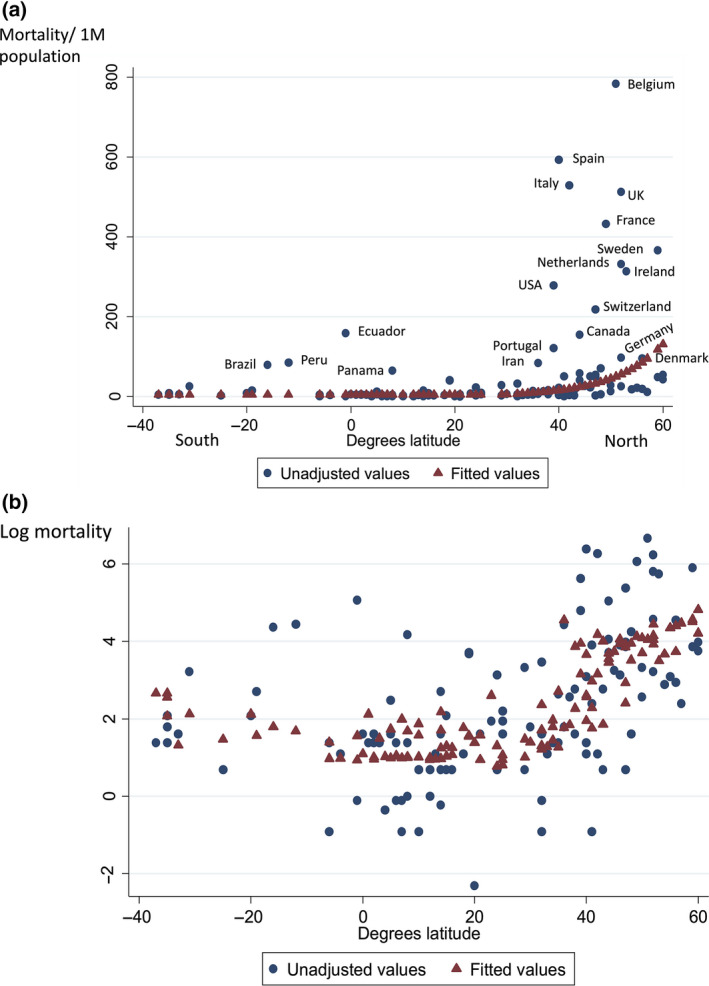
(a) COVID‐19 mortality per 1 million population by country compared with latitude of capital cities. Fitted values are derived from a piecewise linear model of the logarithm of mortality on latitude. This was based on a threshold of 28 degrees North that explained the greatest amount of variation. (b) Logarithm of COVID‐19 mortality per 1 million compared with latitude with and without adjustment for age (%≥65 years). Data accessed 18 May 2020. Reproduced from [3] with permission.