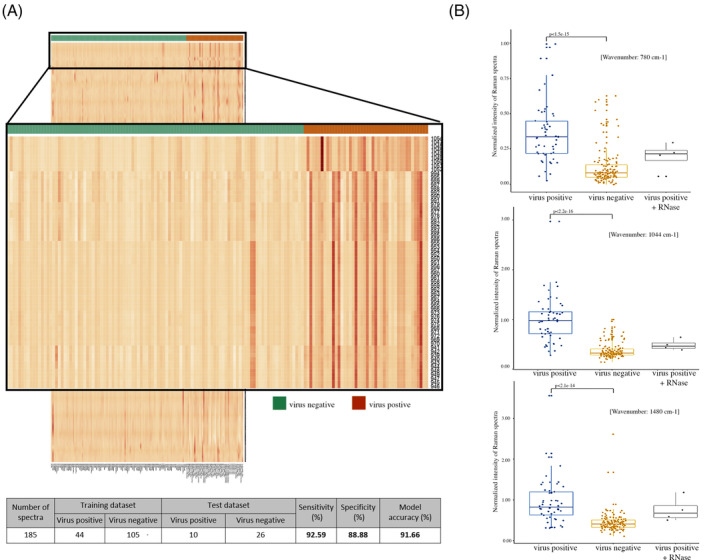
FIGURE 1.

A Raman spectroscopy‐based model to detect RNA viruses. A, Heatmap representation of the 1200 features from the virus positive and negative training sample set of Raman spectra with the zoomed‐out version showing the peak intensities for the features selected (n = 65) for model construction. The table shows the overall sample statistics and summary of the performance of the 65‐feature linear discriminant analysis‐based model for prediction of viral presence in the human saliva samples. B, Comparison of Raman spectra peaks between virus positive, virus negative and RNase‐treated viral positive sample for RNA‐specific constituents: the nitrogenous uracil base, ribose‐phosphate and A/G ring at 780, 1044 and 1480 cm−1, respectively by Wilcoxon rank‐sum test
