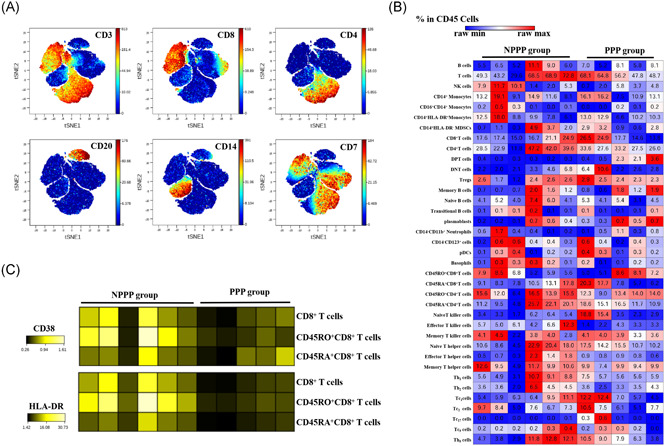
Figure 1.

Flight cytometry (CyTOF)‐based analysis identified immune cell signatures in peripheral blood of patients with coronavirus disease 2019 (COVID‐19). A representative viSNE plot of immune cell populations from patients with persistently PCR positive (PPP) and non‐persistently PCR positive (NPPP). A, viSNE analysis from Cytobank indicated subsets of blood cells, and expression levels of relative markers were also displayed. B, Heatmap displayed percentage of different cell populations in CD45+ peripheral blood mononuclear cells (PBMCs) by raw max/min manner. C, Raw data of CD38 and HLA‐DR expression in subpopulations of blood cells were shown in heatmap
