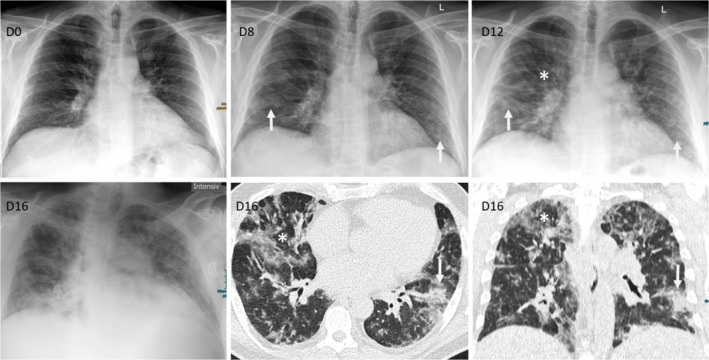
Figure 1.

Radiological Imaging. Chest X‐ray during the course of the disease demonstrated new and increasing infiltrates; D0: normal X‐ray without infiltrations, D8: new COVID‐19 suspicious ground‐glass infiltrations with peripheral and basal distribution (arrow), D12: increasing COVID‐19 suspicious infiltrations with beginning consolidations (arrow), but also additional new unspecific diffuse ground‐glass infiltrations central and apical (asterisk), and D16: X‐ray and low‐dose CT demonstrating a mixed pattern of COVID‐19 suspicious peripheral consolidations with partly crazy paving (arrow) and unspecific viral diffuse ground‐glass infiltrations (asterisk) with peripheral and central distribution (D = day; given are the days after first positive SARS‐CoV‐2 PCR) [Colour figure can be viewed at wileyonlinelibrary.com]
