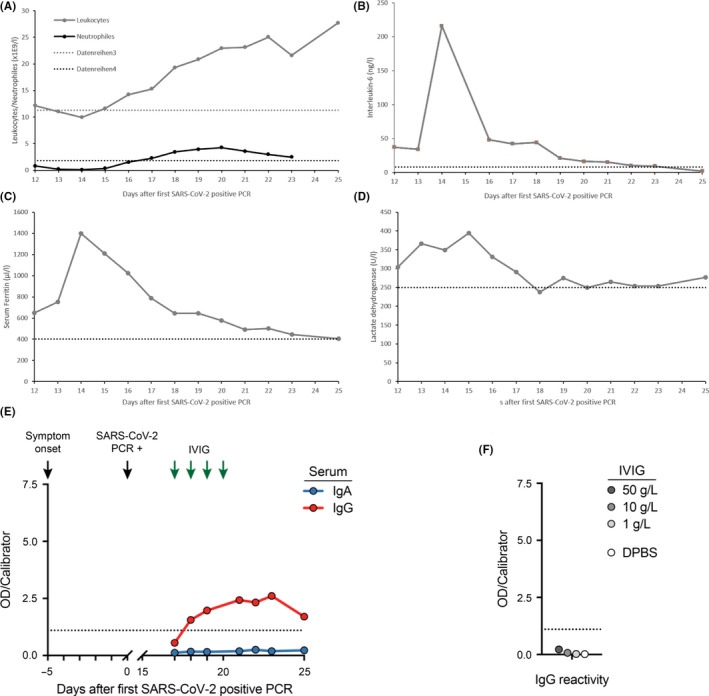
Figure 2.

Changes in laboratory markers and SARS‐CoV‐2 spike protein reactivity ELISA. Figures show changes in leukocytes and neutrophils (A), IL‐6 (B), serum ferritin (C), lactate dehydrogenase (D), IgA and IgG reactivity of serum samples (E), and IgG reactivity of the IVIG lot used for treatment of hypogammaglobulinemia and IVIG dilutions in DPBS as determined by ELISA against the S1 domain of the SARS‐CoV‐2 spike protein S (F). Arrows indicate symptom onset, initial SARS‐CoV‐2‐positive PCR, and IVIG administration (30 g each), respectively. Dashed lines indicate upper reference values (figure A‐D) and assay cutoff for positivity (figure E and F) [Colour figure can be viewed at wileyonlinelibrary.com]
