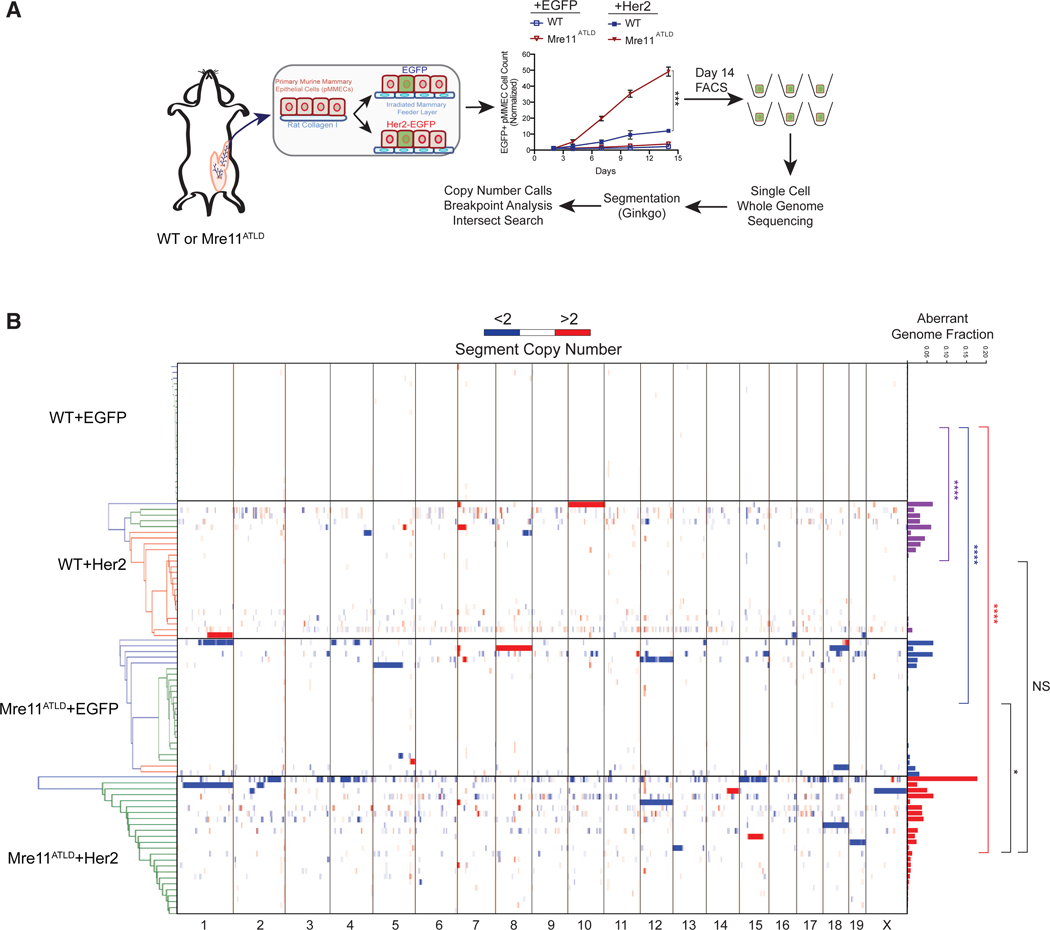
Figure 1. Oncogene Expression Rapidly Induces Copy Number Aberrations in Individual pMMECs.

(A) Schematic representation of the single-cell, whole-genome sequencing process. WT or Mre11ATLD pMMECs were transduced with EGFP or Her2-EGFP. Growth curves on an irradiated feeder layer are shown. The mean of three biological replicates is shown with error bars depicting the standard error of the mean (SEM). ***p < 0.001, calculated using a two-tailed t test on log transformed day 14 data. On day 14, fluorescence-activated cell sorting (FACS) was performed to sort single EGFP+ cells into a 96-well microtiter plate. These cells were then processed for sequencing as described in the methods.
(B) Heatmap showing copy number of individual segments for each cell. The individual cells are clustered by geometric distance, which does not reveal any clonal relationships. The histograms at the right show the total fraction of aberrant genome per cell. p values were calculated by two-tailed Mann-Whitney test. ****p < 0.0001; *p < 0.05.
See also Figure S1.
