
Figure 4. Mre11 Suppresses Oncogene-Induced DNA Damage and R-Loops in p53-Proficient and p53-Deficient Models.
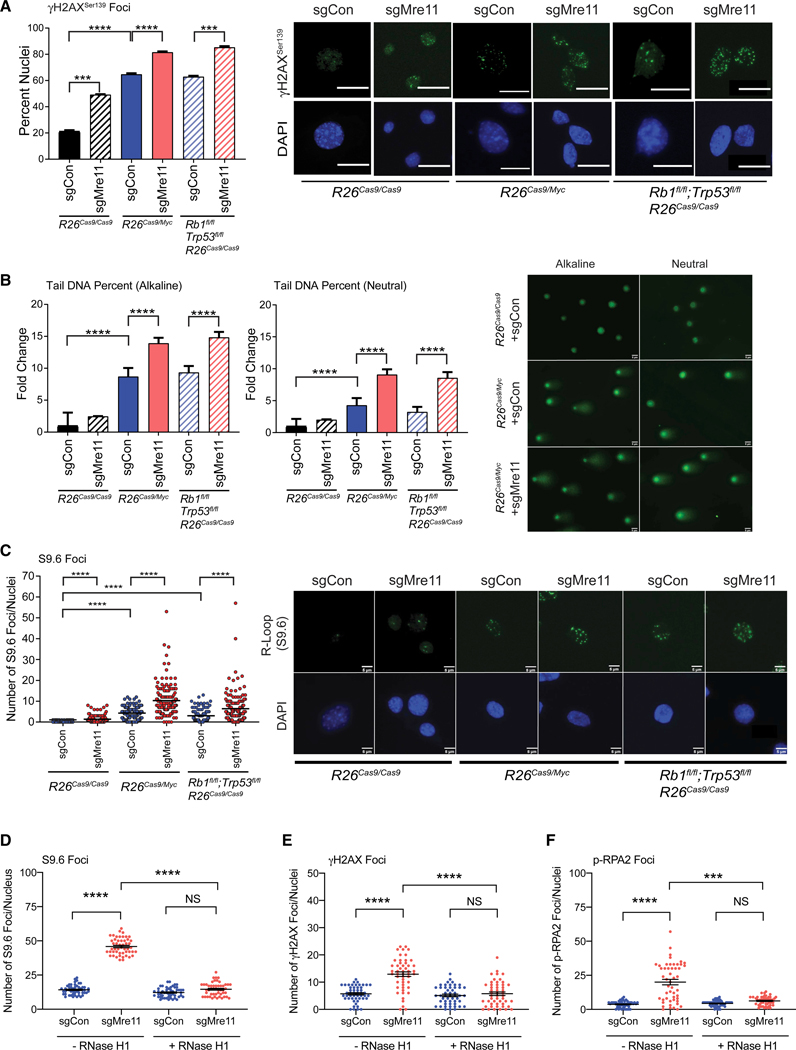
(A) Mre11 suppresses oncogene-induced γH2AX foci formation in both p53-proficient and p53-deficient pMMECs. Bar graphs show quantification of the percent of nuclei containing ≥5 γH2AXfoci in the different genotypes. Representative images (right) of the nuclei containing γH2AX foci are shown. White bar indicates 5 μm.
(B) Bar graphs depicting the fold change in tail DNA percent for both alkaline (left) and neutral (right) COMET assays in pMMECs with the genotypes shown post-Cre-sgRNA transduction. Representative images of alkaline and neutral COMETs in R26Cas9+sgControl, R26Cas9/Myc+sgControl, and R26Cas9/Myc+sgMre11 pMMECs are shown. Data are represented as mean ± SEM.
(C) Mre11 suppresses oncogene-induced R-loop formation independently of Trp53. Scatterplot shows a quantification of the nuclear S9.6foci in pMMECs from the genetic backgrounds shown after transduction with Cre-sgControl versus Cre-sgMre11. Representative images (right) of the nuclei containing S9.6 foci are shown. White bar indicates 5 μm.
(D) S9.6 (R-loop) foci after RNase H1 overexpression in R26CasaRb1fl/flTrp53fl/fl pMMECs transduced with Cre-sgControl or Cre-sgMre11.
(E and F) Additionally, RNase H1 overexpression counteracts the increase in (E) γH2AX and (F) p-RPA2 foci seen in Mre11 hypomorphic R26CasaRb1fl/flTrp53fl/fl pMMECs.
***p < 0.001; ****p < 0.0001. p values are calculated using a two-tailed Mann-Whitney test.
See also Figure S4.