
Figure 5. Cell Proliferation, R-Loops,and Genomic LossSignatureAre Elevated inRb1−/−Trp53−/− MammaryTumors Engineeredwith Mre11 Hypomorphism.
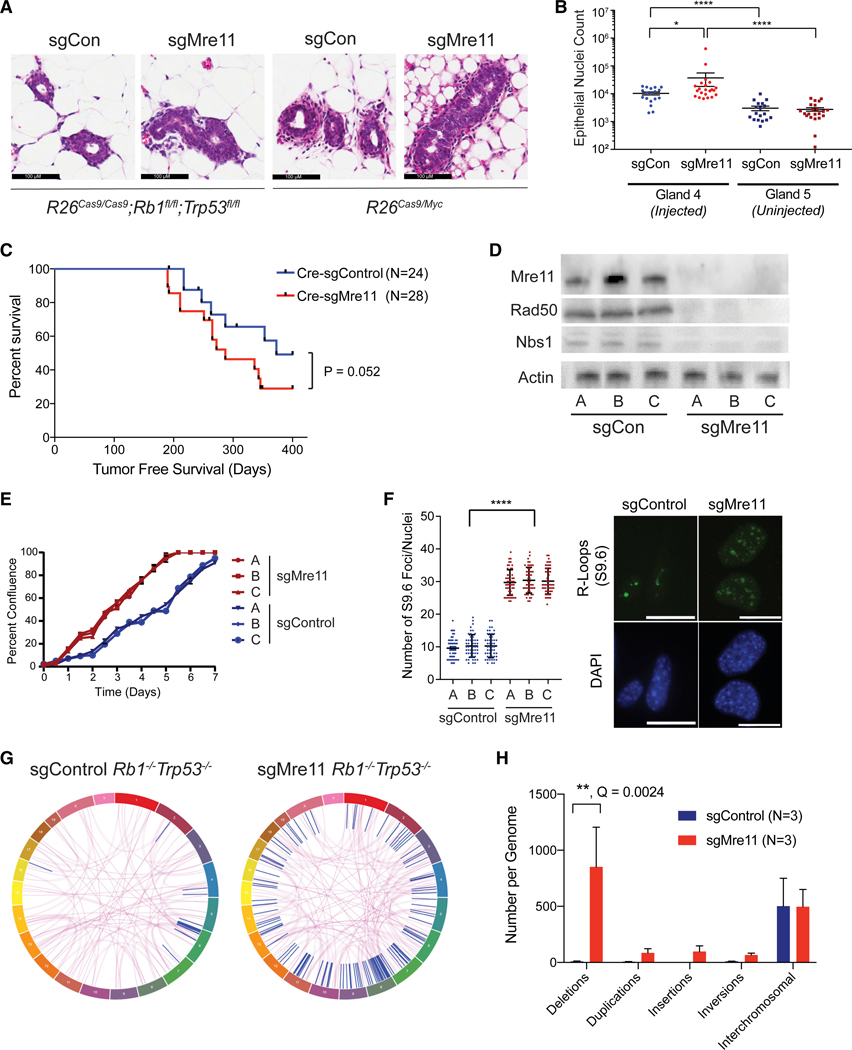
(A) Representative images of mammary hyperplasia 2 weeks after intraductal injection of R26Cas9Rb1fl/flTrp53fl/fl or R26Cas9/Myc mice with Cre-sgControl or Cre-sgMrell-expressing lentivirus.
(B) Quantification of mammary hyperplasia in R26Cas9Rb1fl/flTrp53fl/fl mice as shown in(A). The fifth, non-injected, mammary gland serves as a negative control. Data are represented as mean ± SEM. Significance was determined using two-tailed Mann-Whitney test.
(C) Kaplan-Meier tumor-free survival plot of R26Cas9Rb1fl/flTrp53fl/fl mice after mammary intraductal injection of either Cre-sgControl or Cre-sgMre11 lentivirus. p value was calculated using a two-tailed Gehan-Breslow-Wilcoxon test.
(D) Mre11, Rad50, and Nbs1 protein levels in tumorsfrom mice in (C), validating protein destabilization induced by CRISPR/Cas9-mediated Mre11 mutagenesis.
(E) Cellsfrom the sgMre11 tumors growfaster in vitro than cellsfrom the sgControl tumors. Three independenttumor lines are shown for each genotype. Growth curves were acquired using the Incucyte Live Cell Analysis system. Data are represented as mean ± SEM.
(F) Cellsfrom sgMre11-derived tumors have more R-loops than cells from sgControl tumors. Three independent tumor lines of each genotype were evaluated by immunofluorescence using the S9.6 antibody. Data are represented as mean ± standard deviation. Significance was determined using a two-tailed Mann-Whitney test.
(G) Representative circos plot of structural variations identified by whole-genome sequencing of WT or Mre11 hypomorphic mammary tumors derived from the R26Cas9Rb1fl/flTrp53fl/fl model. Purple lines indicate translocations between different chromosomes. Blue lines indicate intra-chromosomal rearrangements.
(H) Analysis of structural aberrations identified from tumor-normal WGS from three WT and three Mre11 hypomorphic mammary tumors from the R26Cas9Rb1fl/flTrp53fl/fl model. Deletions (>50 bp) are highly over-represented in Mrell hypomorphic Rb1−/−Trp53−/− mammary tumors. Data are represented as mean ± SEM. Q value was estimated using a two-tailed t test with false discovery rate correction using Graphpad Prism v8. All other comparisons were not statistically significant (i.e., Q < 0.05).
See also Figure S5.