Figure 6.

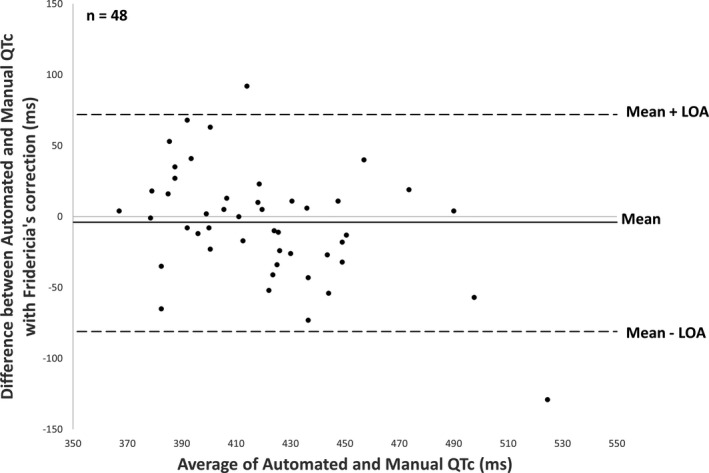
Bland‐Altman plot comparing automated corrected QT generated by ECG machine and manually (Fridericia’s correction). LOA, limits of agreement.

Bland‐Altman plot comparing automated corrected QT generated by ECG machine and manually (Fridericia’s correction). LOA, limits of agreement.