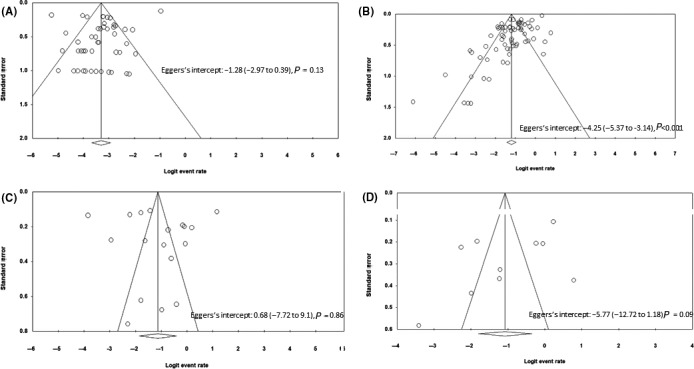
FIGURE 5.

Funnel plot of the studies included for (A) prevalence of chronic liver disease (B) incidence of elevated liver chemistries at initial presentation (C) incidence of elevated liver chemistries during the illness (D) incidence of drug‐induced liver injury
