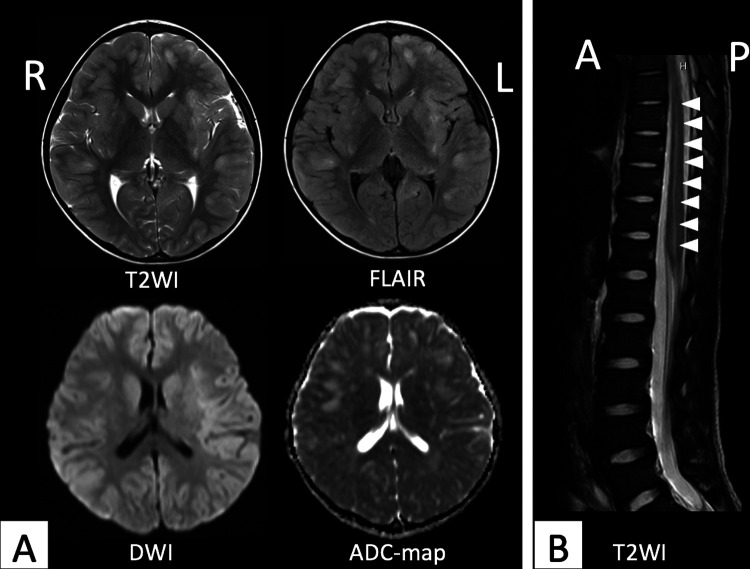
Figure 2.
A, Brain MRI findings in day 8 after the onset. The images showed multifocal high-intensity lesions on corresponding axial T2-weighted imaging, fluid-attenuated inversion recovery imaging, and diffusion-weighted imaging, and a low-intensity lesion on corresponding apparent diffusion coefficient map. B, Spinal MRI findings in day 13 after the onset. The image showed a high-intensity lesion (arrow) in the cervical spinal cord on T2-weighted imaging. A indicates anterior; ADC, apparent diffusion coefficient; DWI, diffusion-weighted imaging; FLAIR, fluid-attenuated inversion recovery imaging; L, left; MRI, magnetic resonance imaging; P, posterior; R, right; T2WI, T2-weighted imaging.

