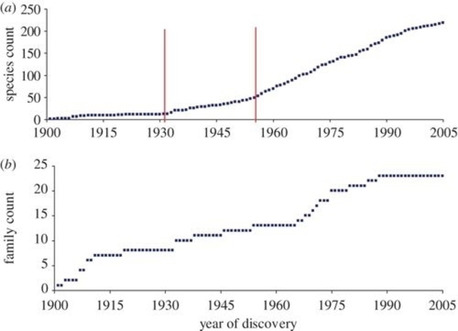
Figure 1.

Discovery curves for human viruses. (a) Virus discovery curve by species. A cumulative number of species reported to infect humans. Statistically significant upward breakpoints are shown (vertical lines). (b) Virus discovery curve by family. A cumulative number of families containing species reported to infect humans. (Copyright permission © 2012 The Royal Society).2
