FIGURE 1.

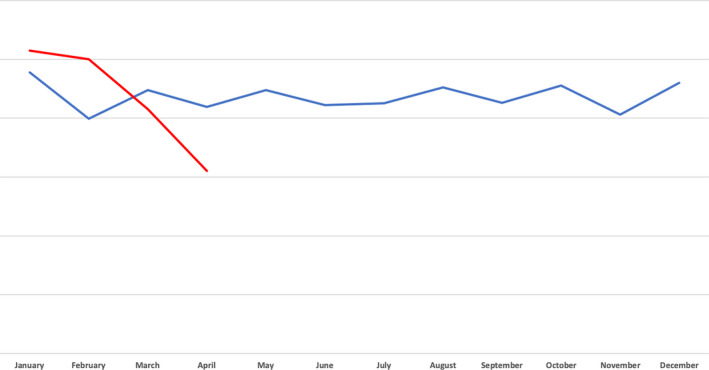
Month by month trend for admissions due to acute stroke and transient ischemic attacks. Blue line—2015‐2019 (average). Red line—2020

Month by month trend for admissions due to acute stroke and transient ischemic attacks. Blue line—2015‐2019 (average). Red line—2020