FIGURE 1.

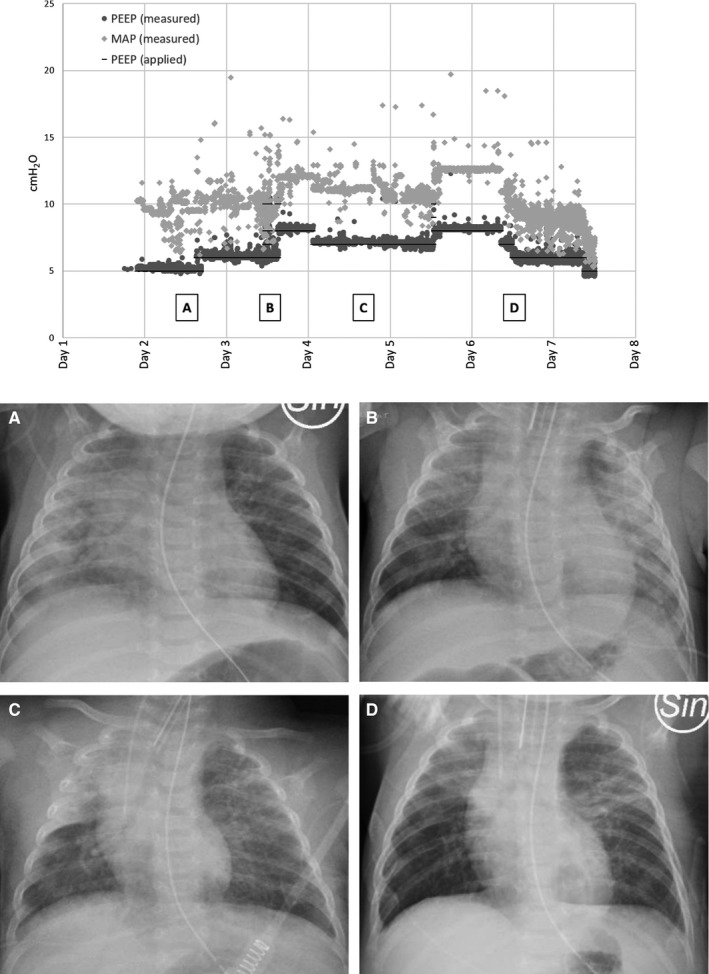
Applied and measured PEEP and mean airway pressure in cm H2O versus ventilatory support days. A, B, C and D denote when the chest X‐ray images were obtained

Applied and measured PEEP and mean airway pressure in cm H2O versus ventilatory support days. A, B, C and D denote when the chest X‐ray images were obtained