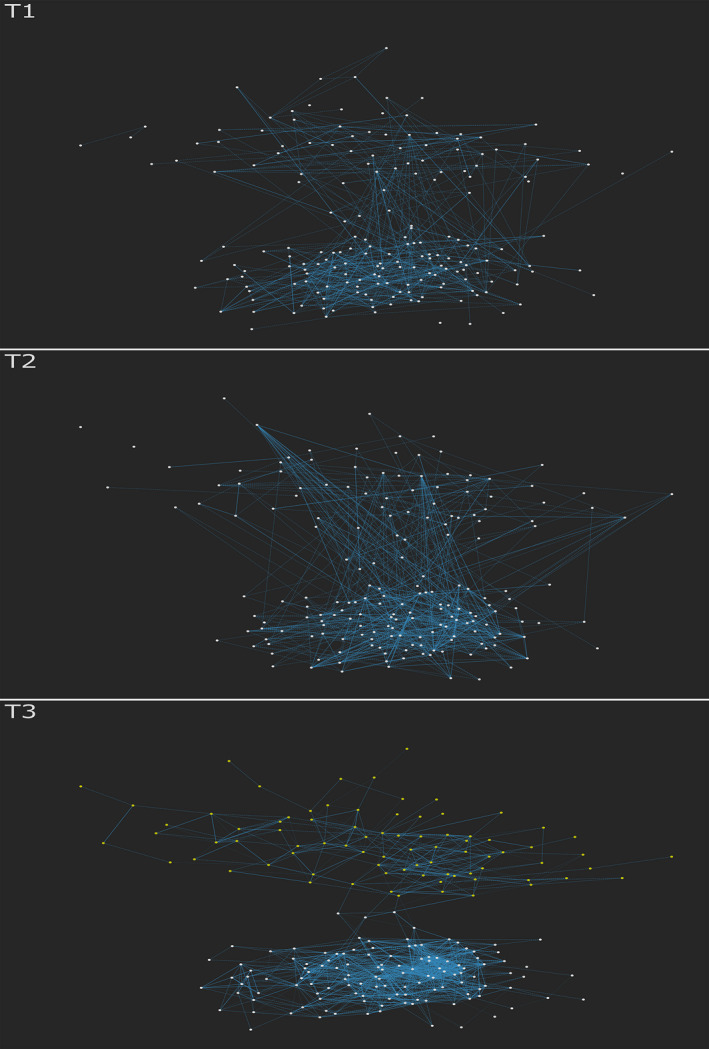
Figure 1.

The participant projection of the survey at each time point. Blue edges represent two participants who agree on many attitudes. Yellow nodes at T3 represent the sceptics cluster. [Colour figure can be viewed at wileyonlinelibrary.com]

The participant projection of the survey at each time point. Blue edges represent two participants who agree on many attitudes. Yellow nodes at T3 represent the sceptics cluster. [Colour figure can be viewed at wileyonlinelibrary.com]