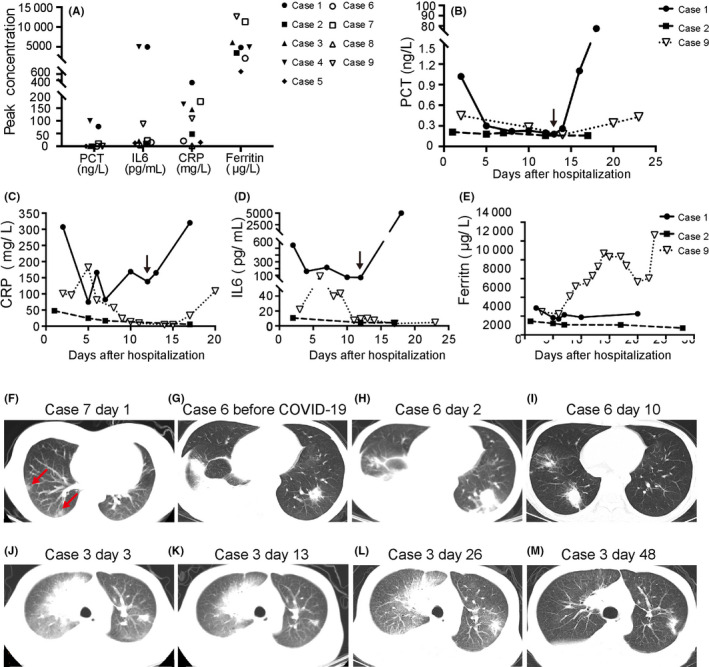
FIGURE 1.

Levels of inflammatory markers in hematological patients infected with severe acute respiratory syndrome coronavirus 2 and features of chest computed tomography (CT). A, Peak concentrations of inflammatory markers in 9 cases. B‐E, Time course of procalcitonin (PCT) (B), C‐reactive protein (CRP) (C), interleukin‐6 (IL‐6) (D), and ferritin (E) levels in cases 1, 2, and 9. F, CT image from Case 7 shows nodules in the subpleural areas on day 1 after symptom onset. G‐I, Axial images from Case 6 showed bilateral patchy consolidations and pleural effusion before (G) and on day 2 after confirmation of COVID‐19 infection (H), and improvement on day 10 (I). J‐M, CT images from Case 3 showed mixed ground glass opacity with consolidation and a single side pleural effusion on day 3 (J), 13 (K), and 26 (L) after symptom onset, and improvement on day 48 (M)
